Sharing Our Knowledge
The First Sinergise Summer School Recap
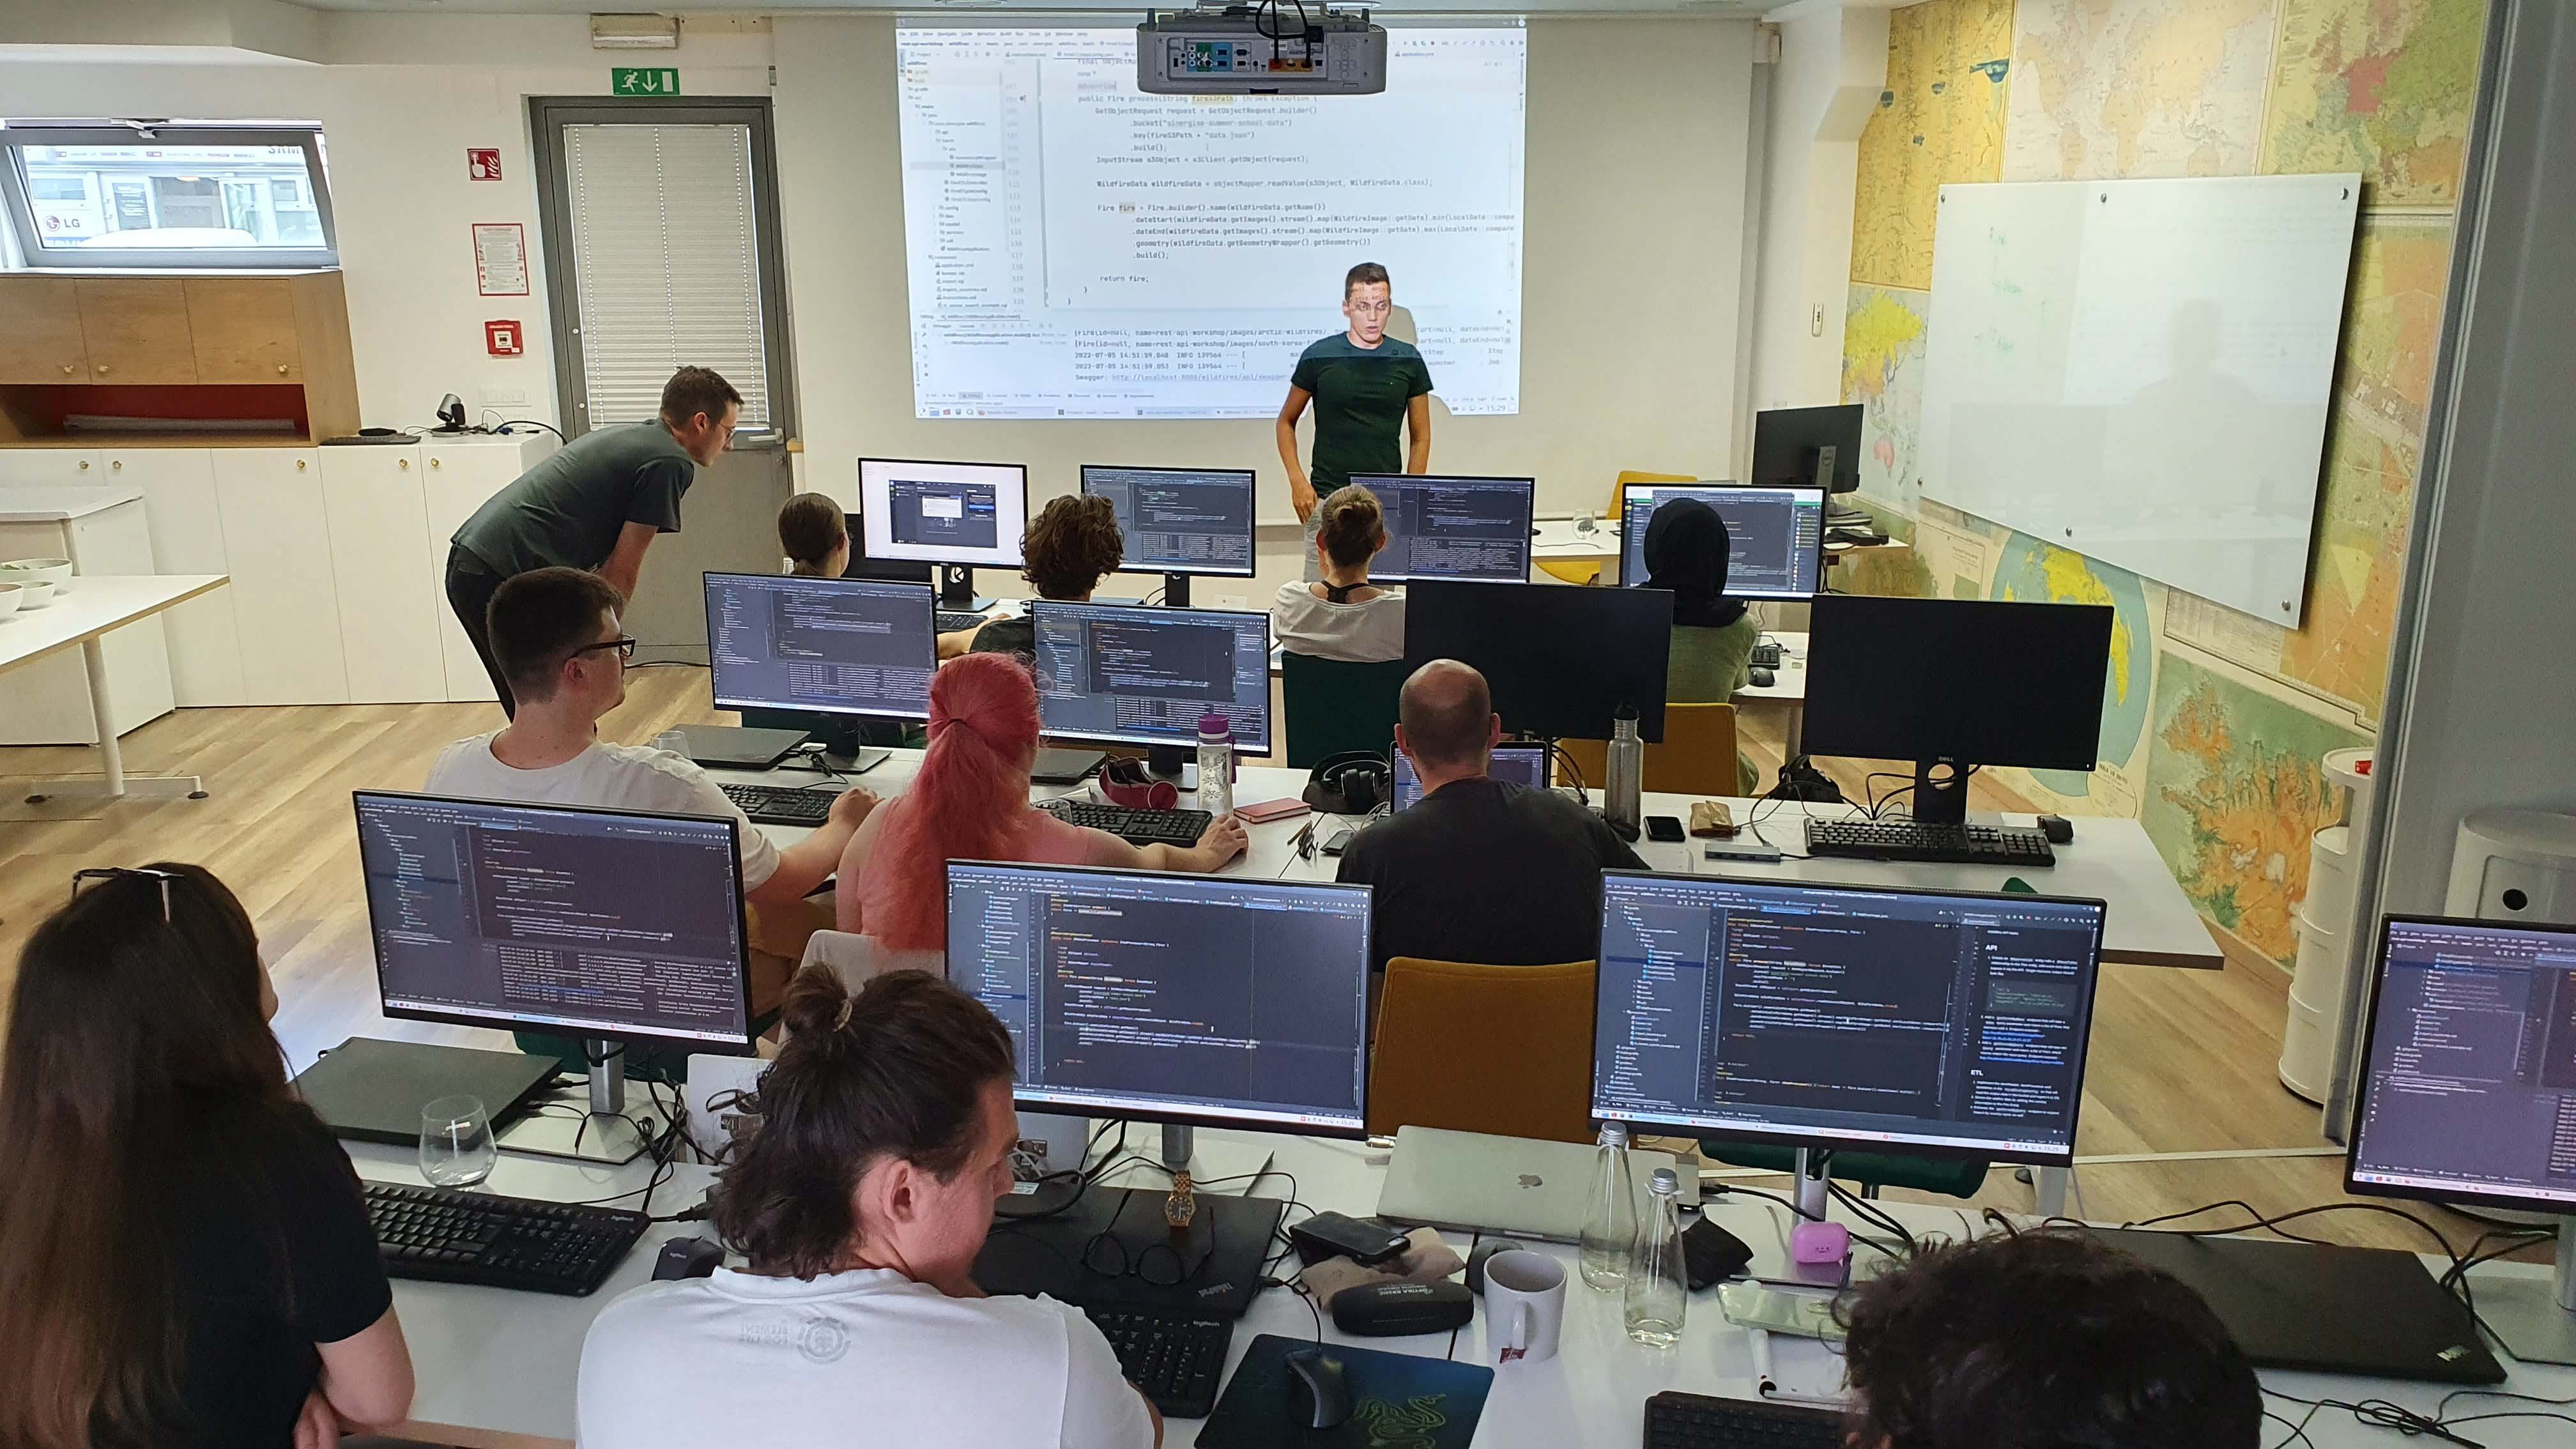
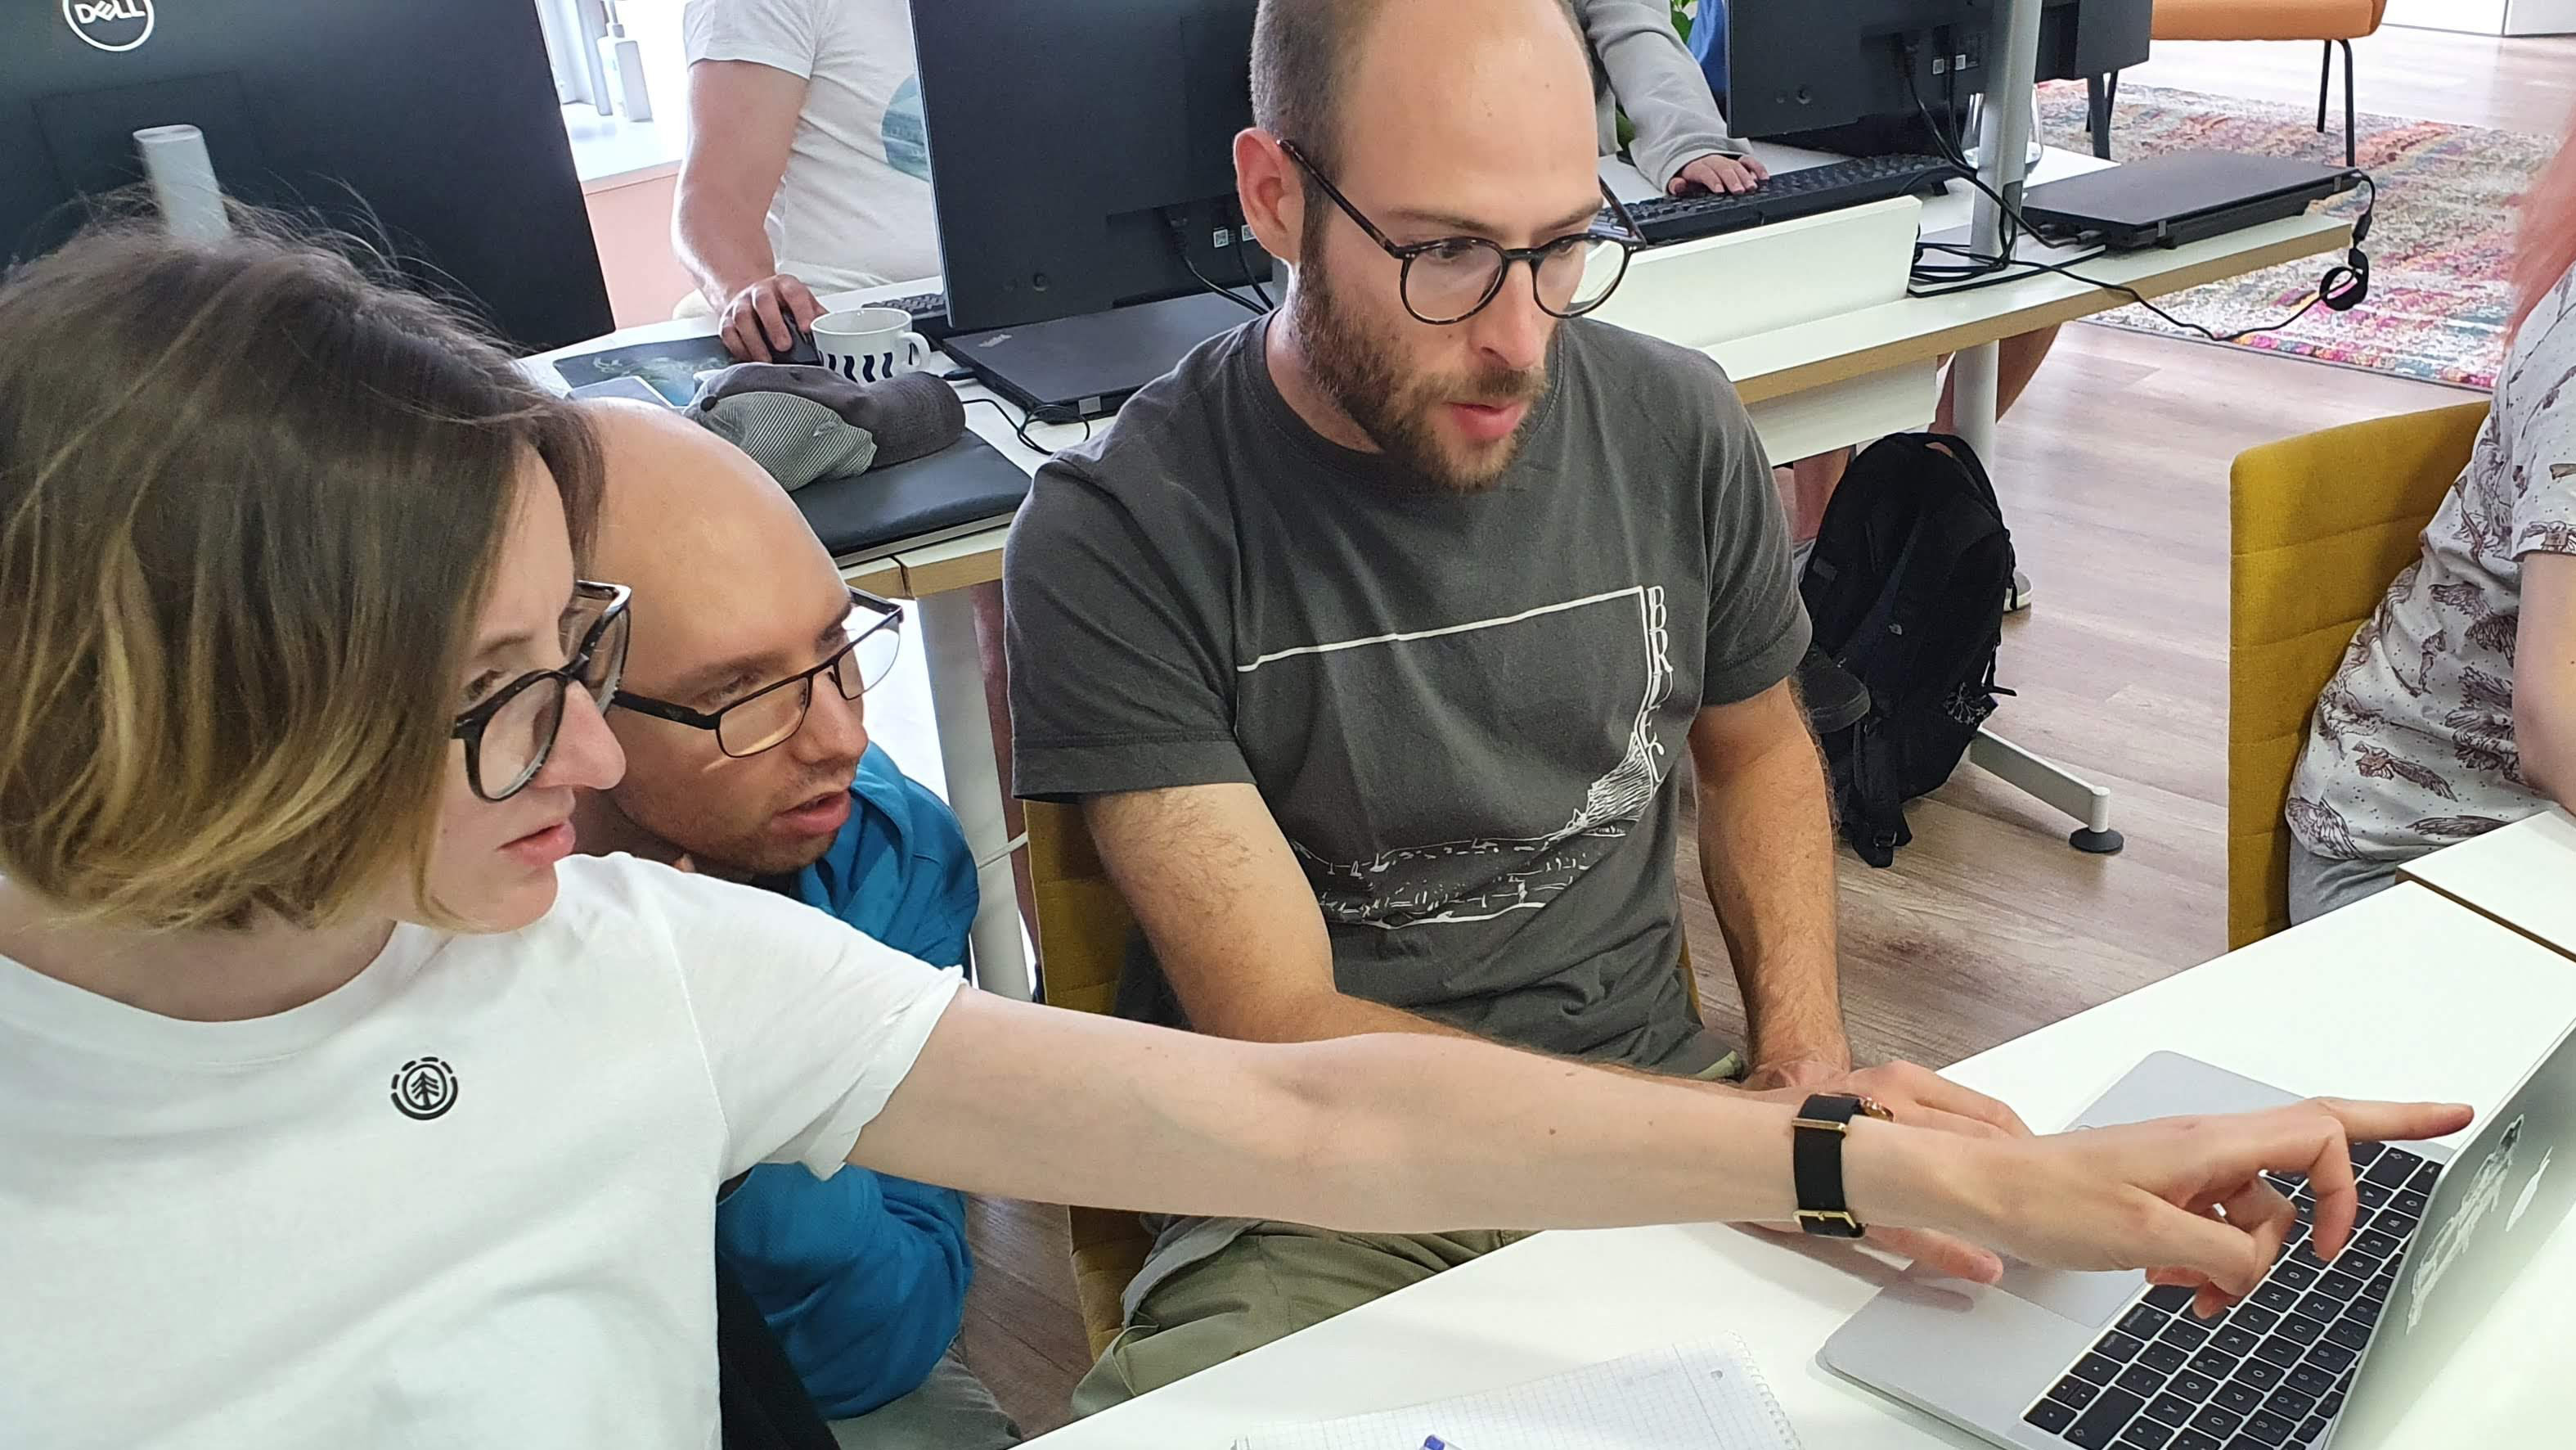
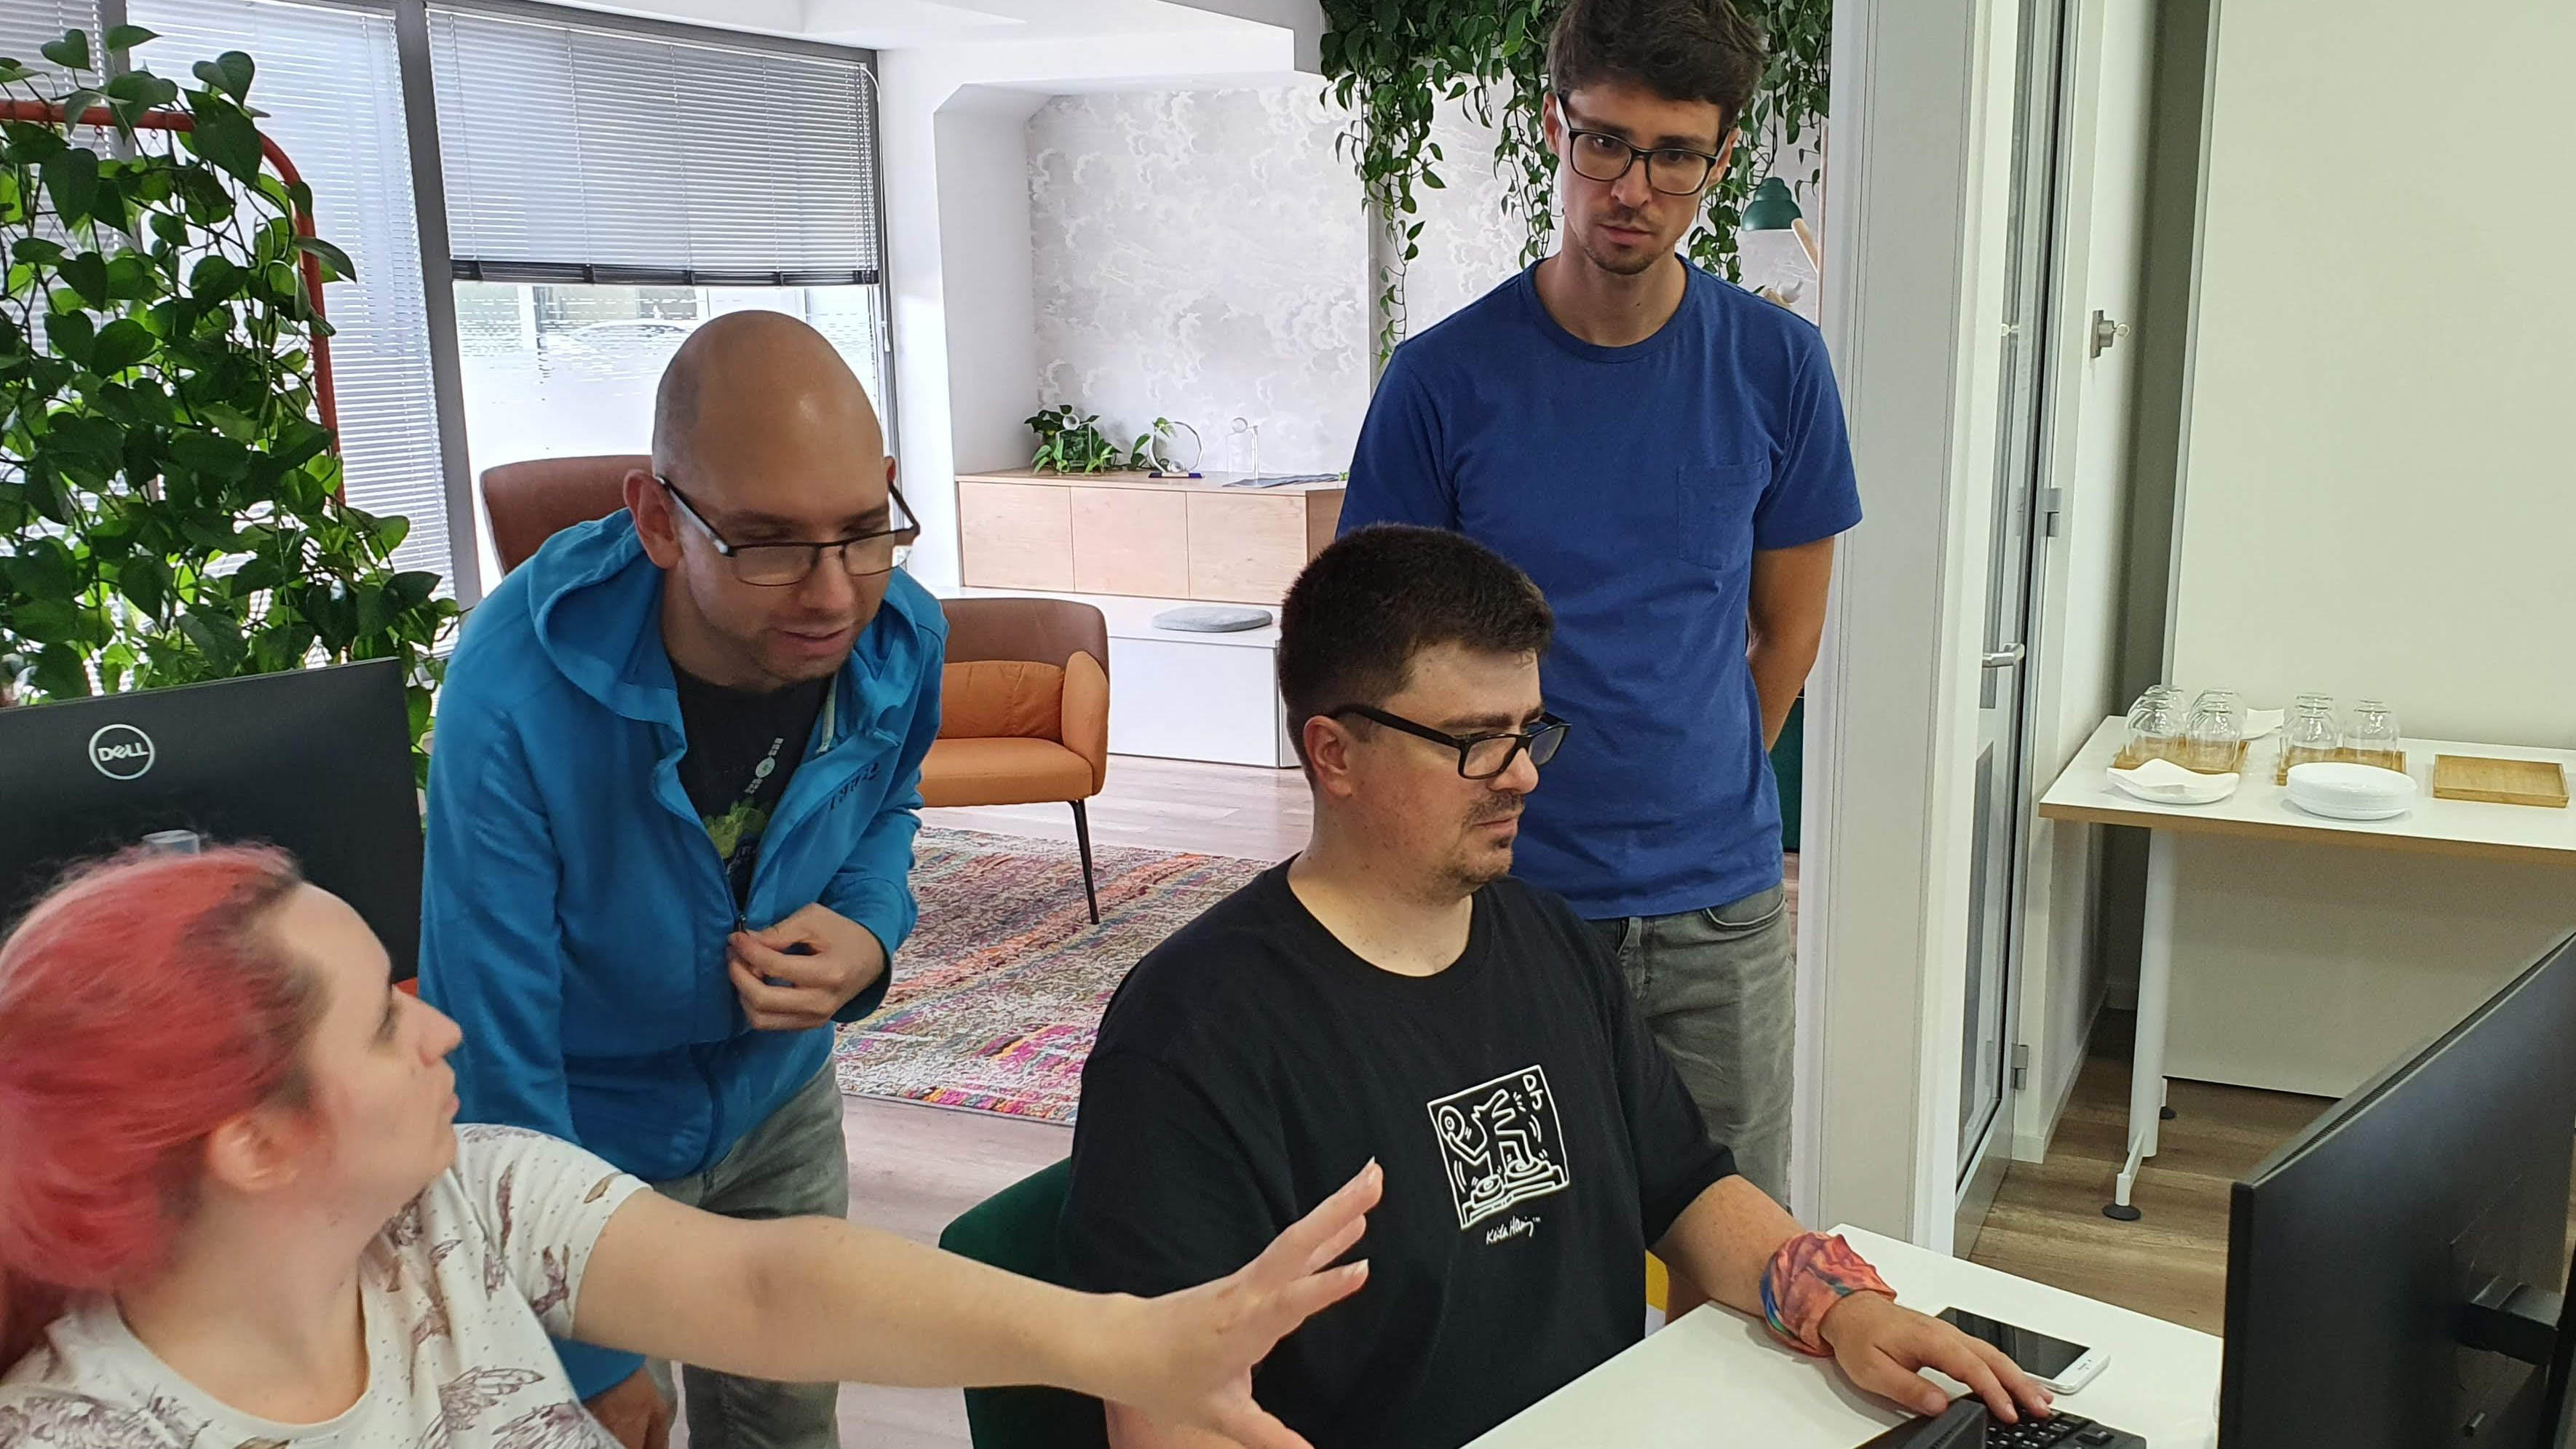
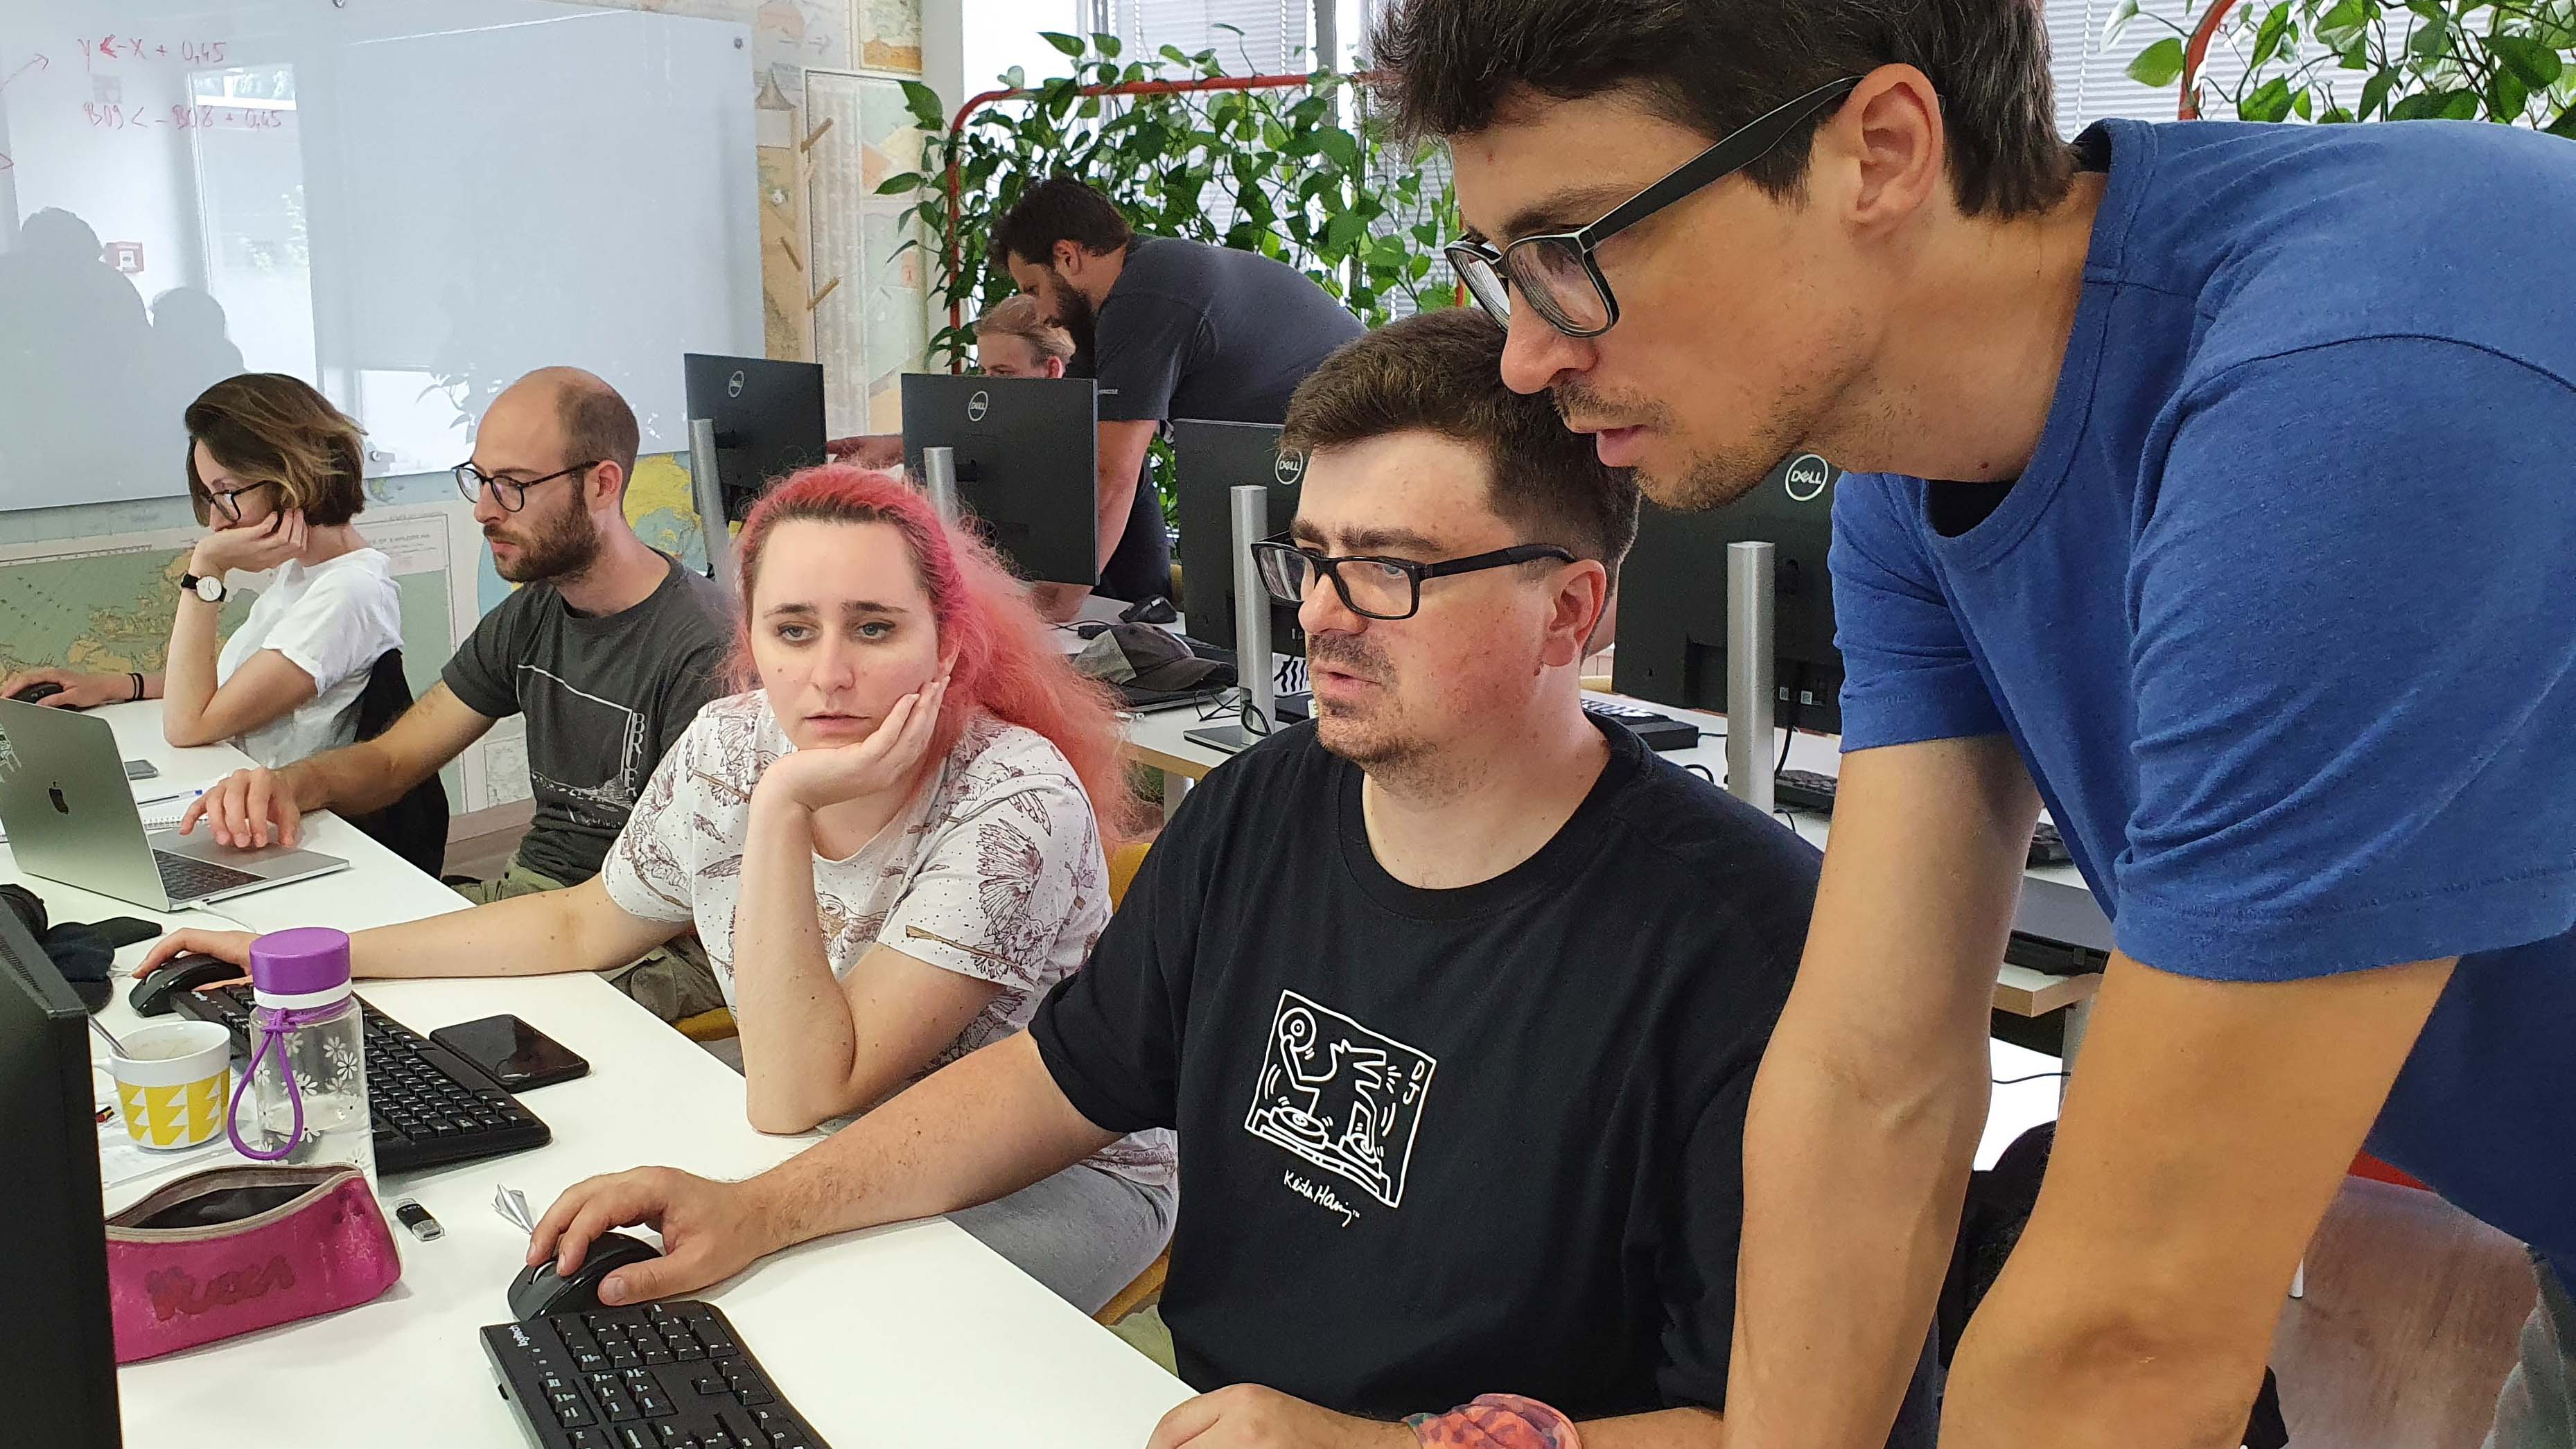
Last week we wrapped our very first edition of Summer School. It was an exciting week for all of us, for the Sinergisers who created a great overall presentation of our company and the technologies we use, and for the participants who were eager to learn how we leverage satellite imagery to create modern applications. The programme consisted of a combination of short introductory lectures followed by practical exercises adapted to the experience and previous knowledge of the participants.
Let's see what we learned
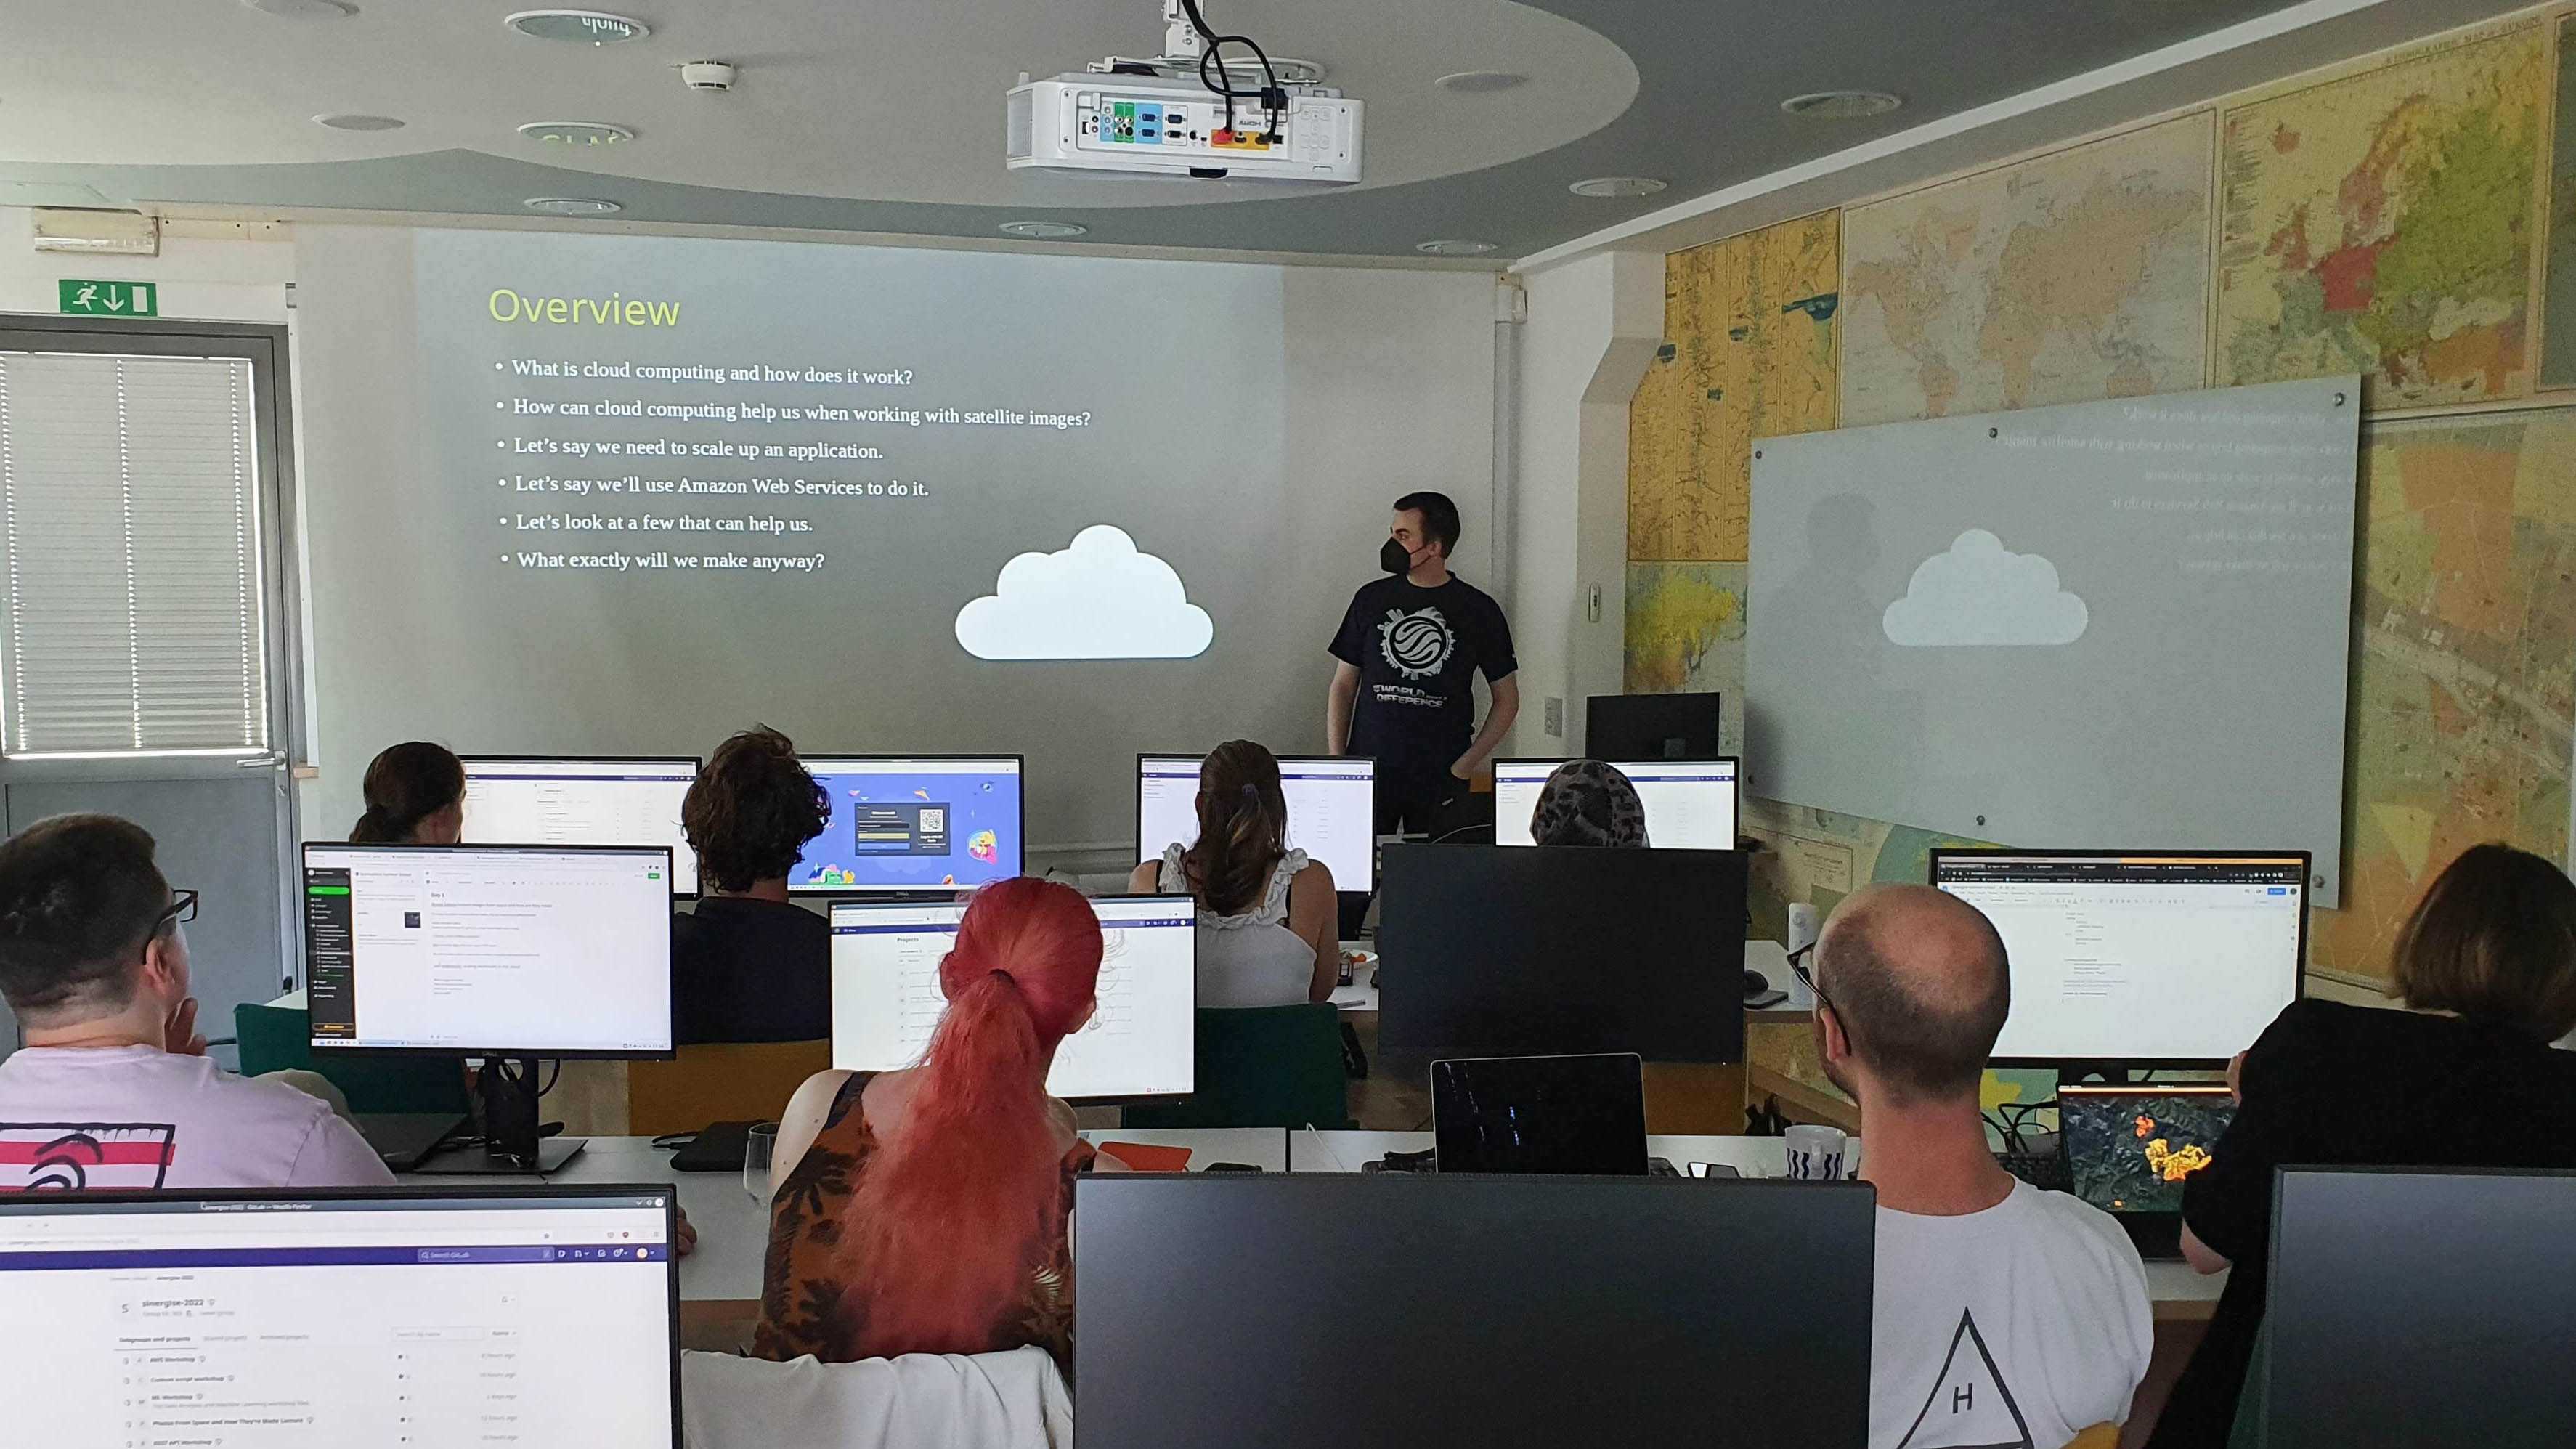
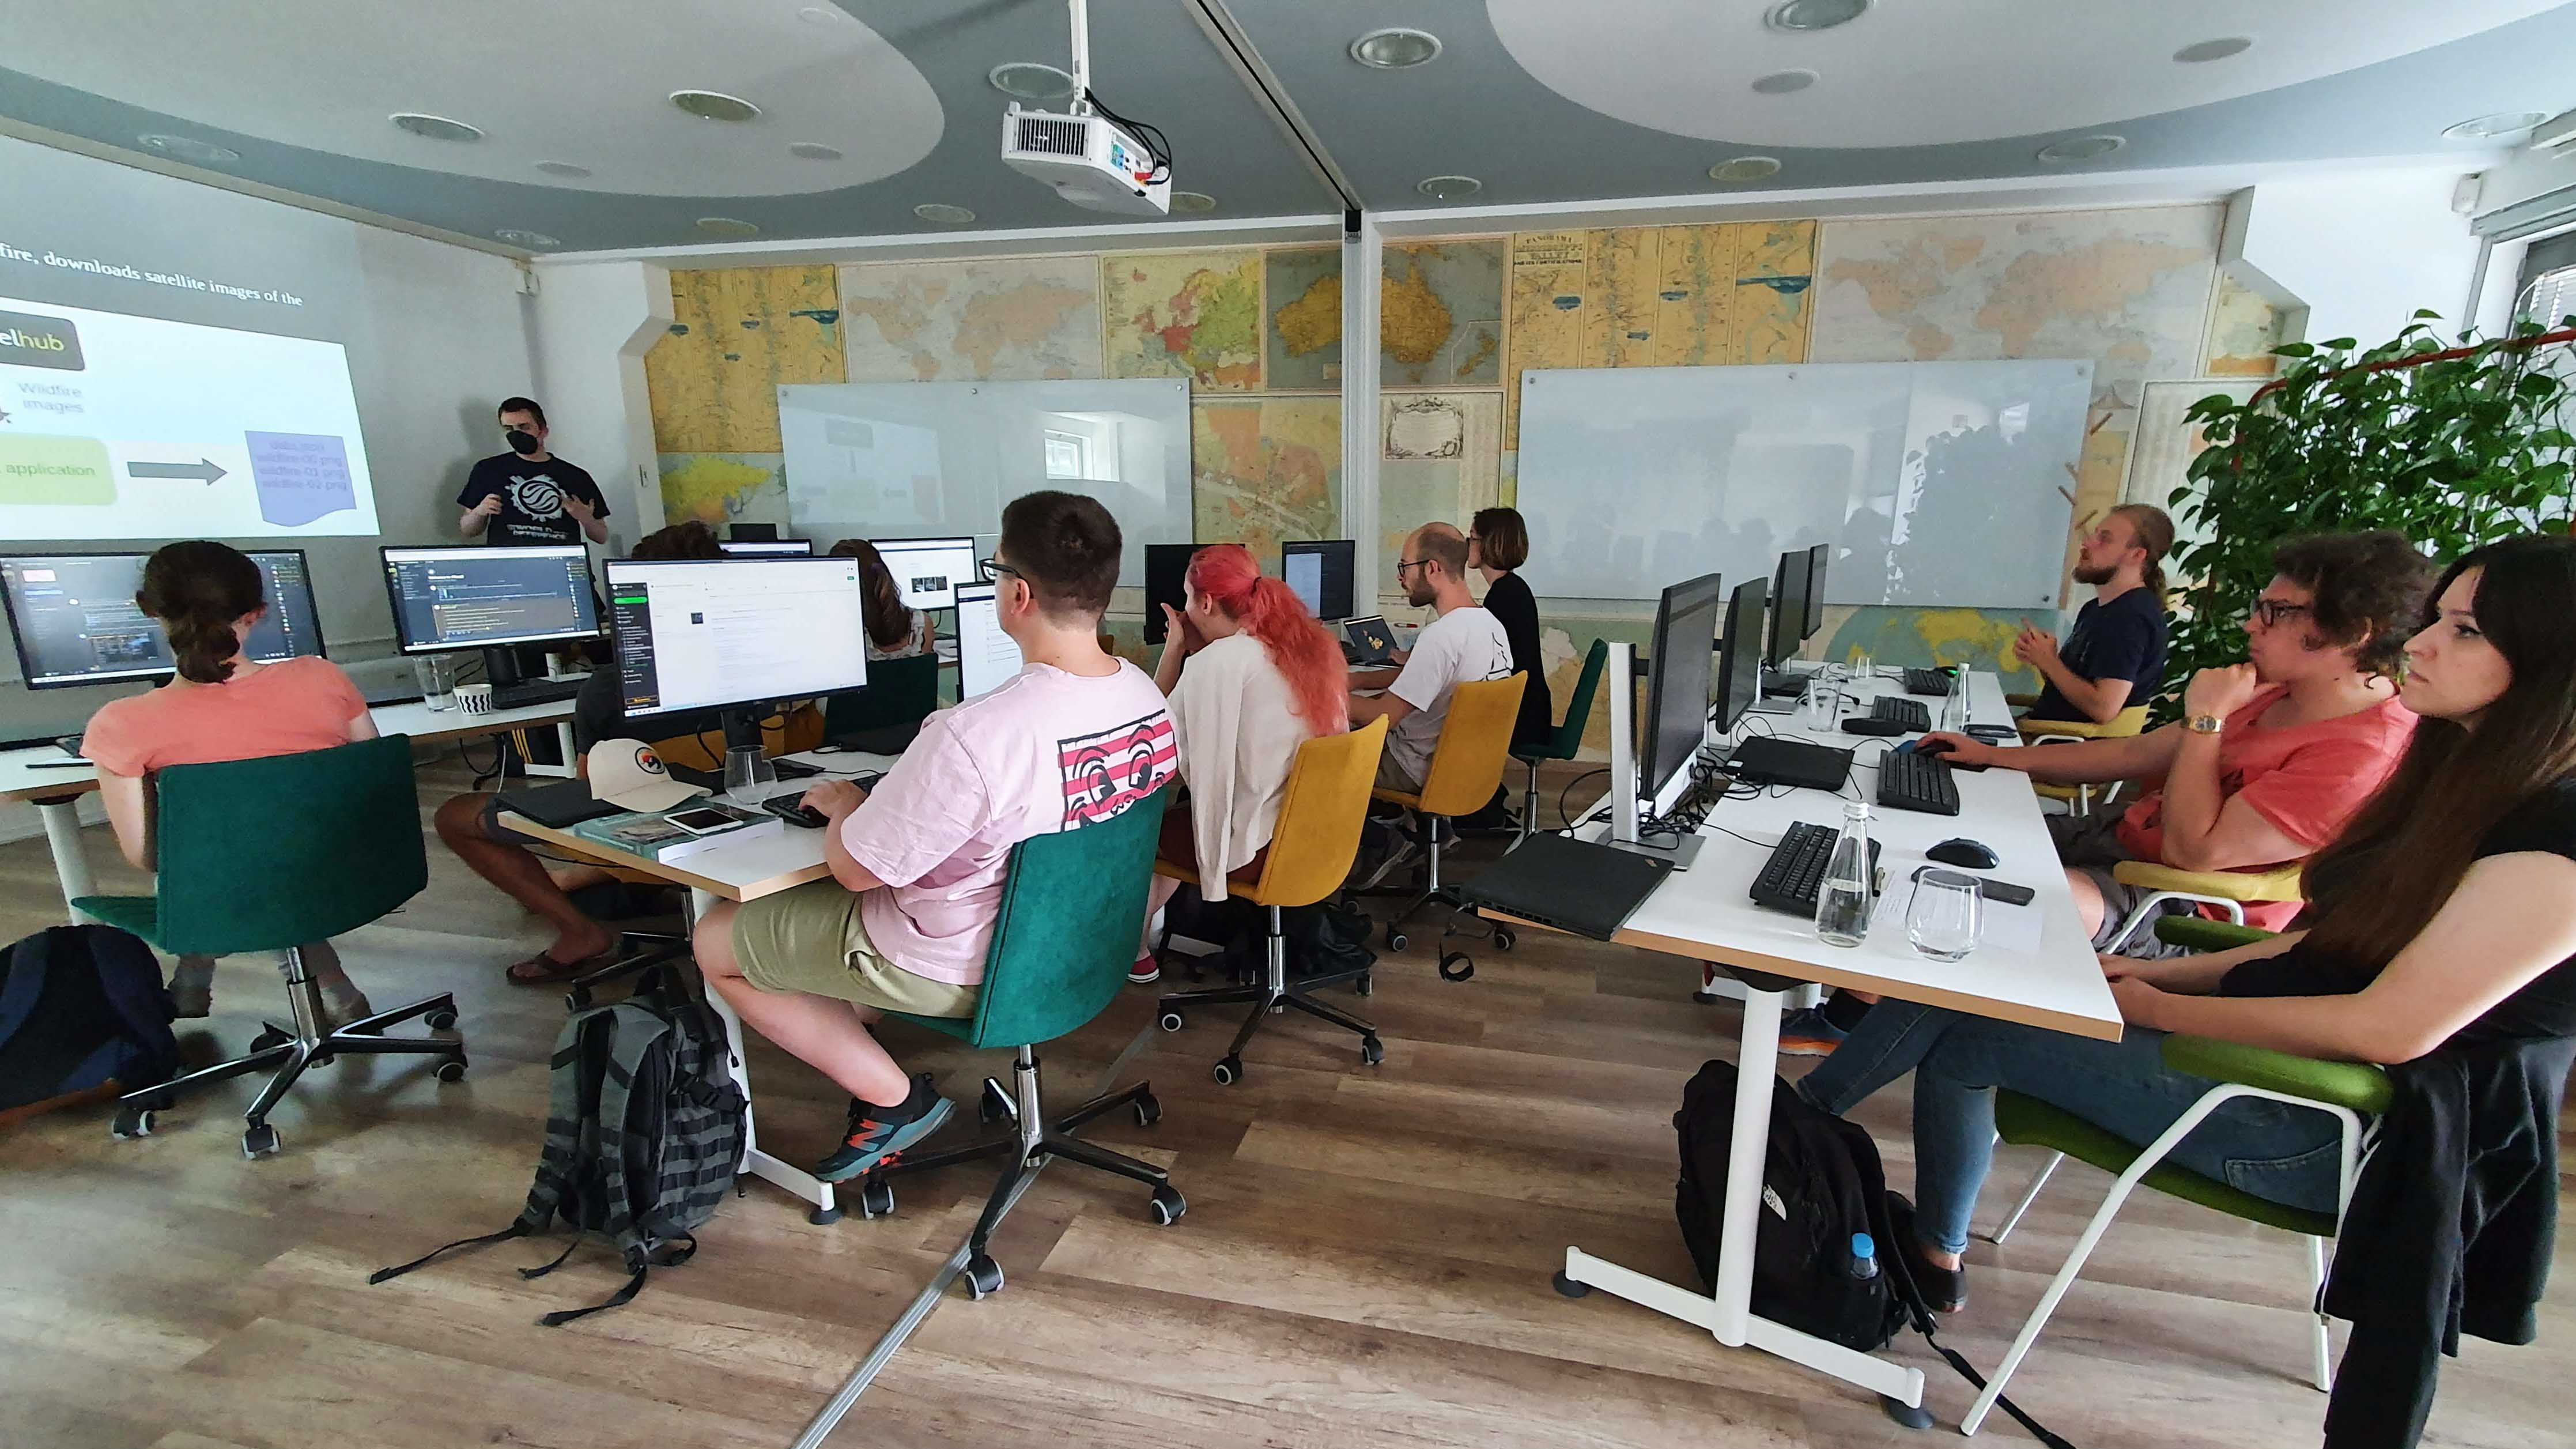
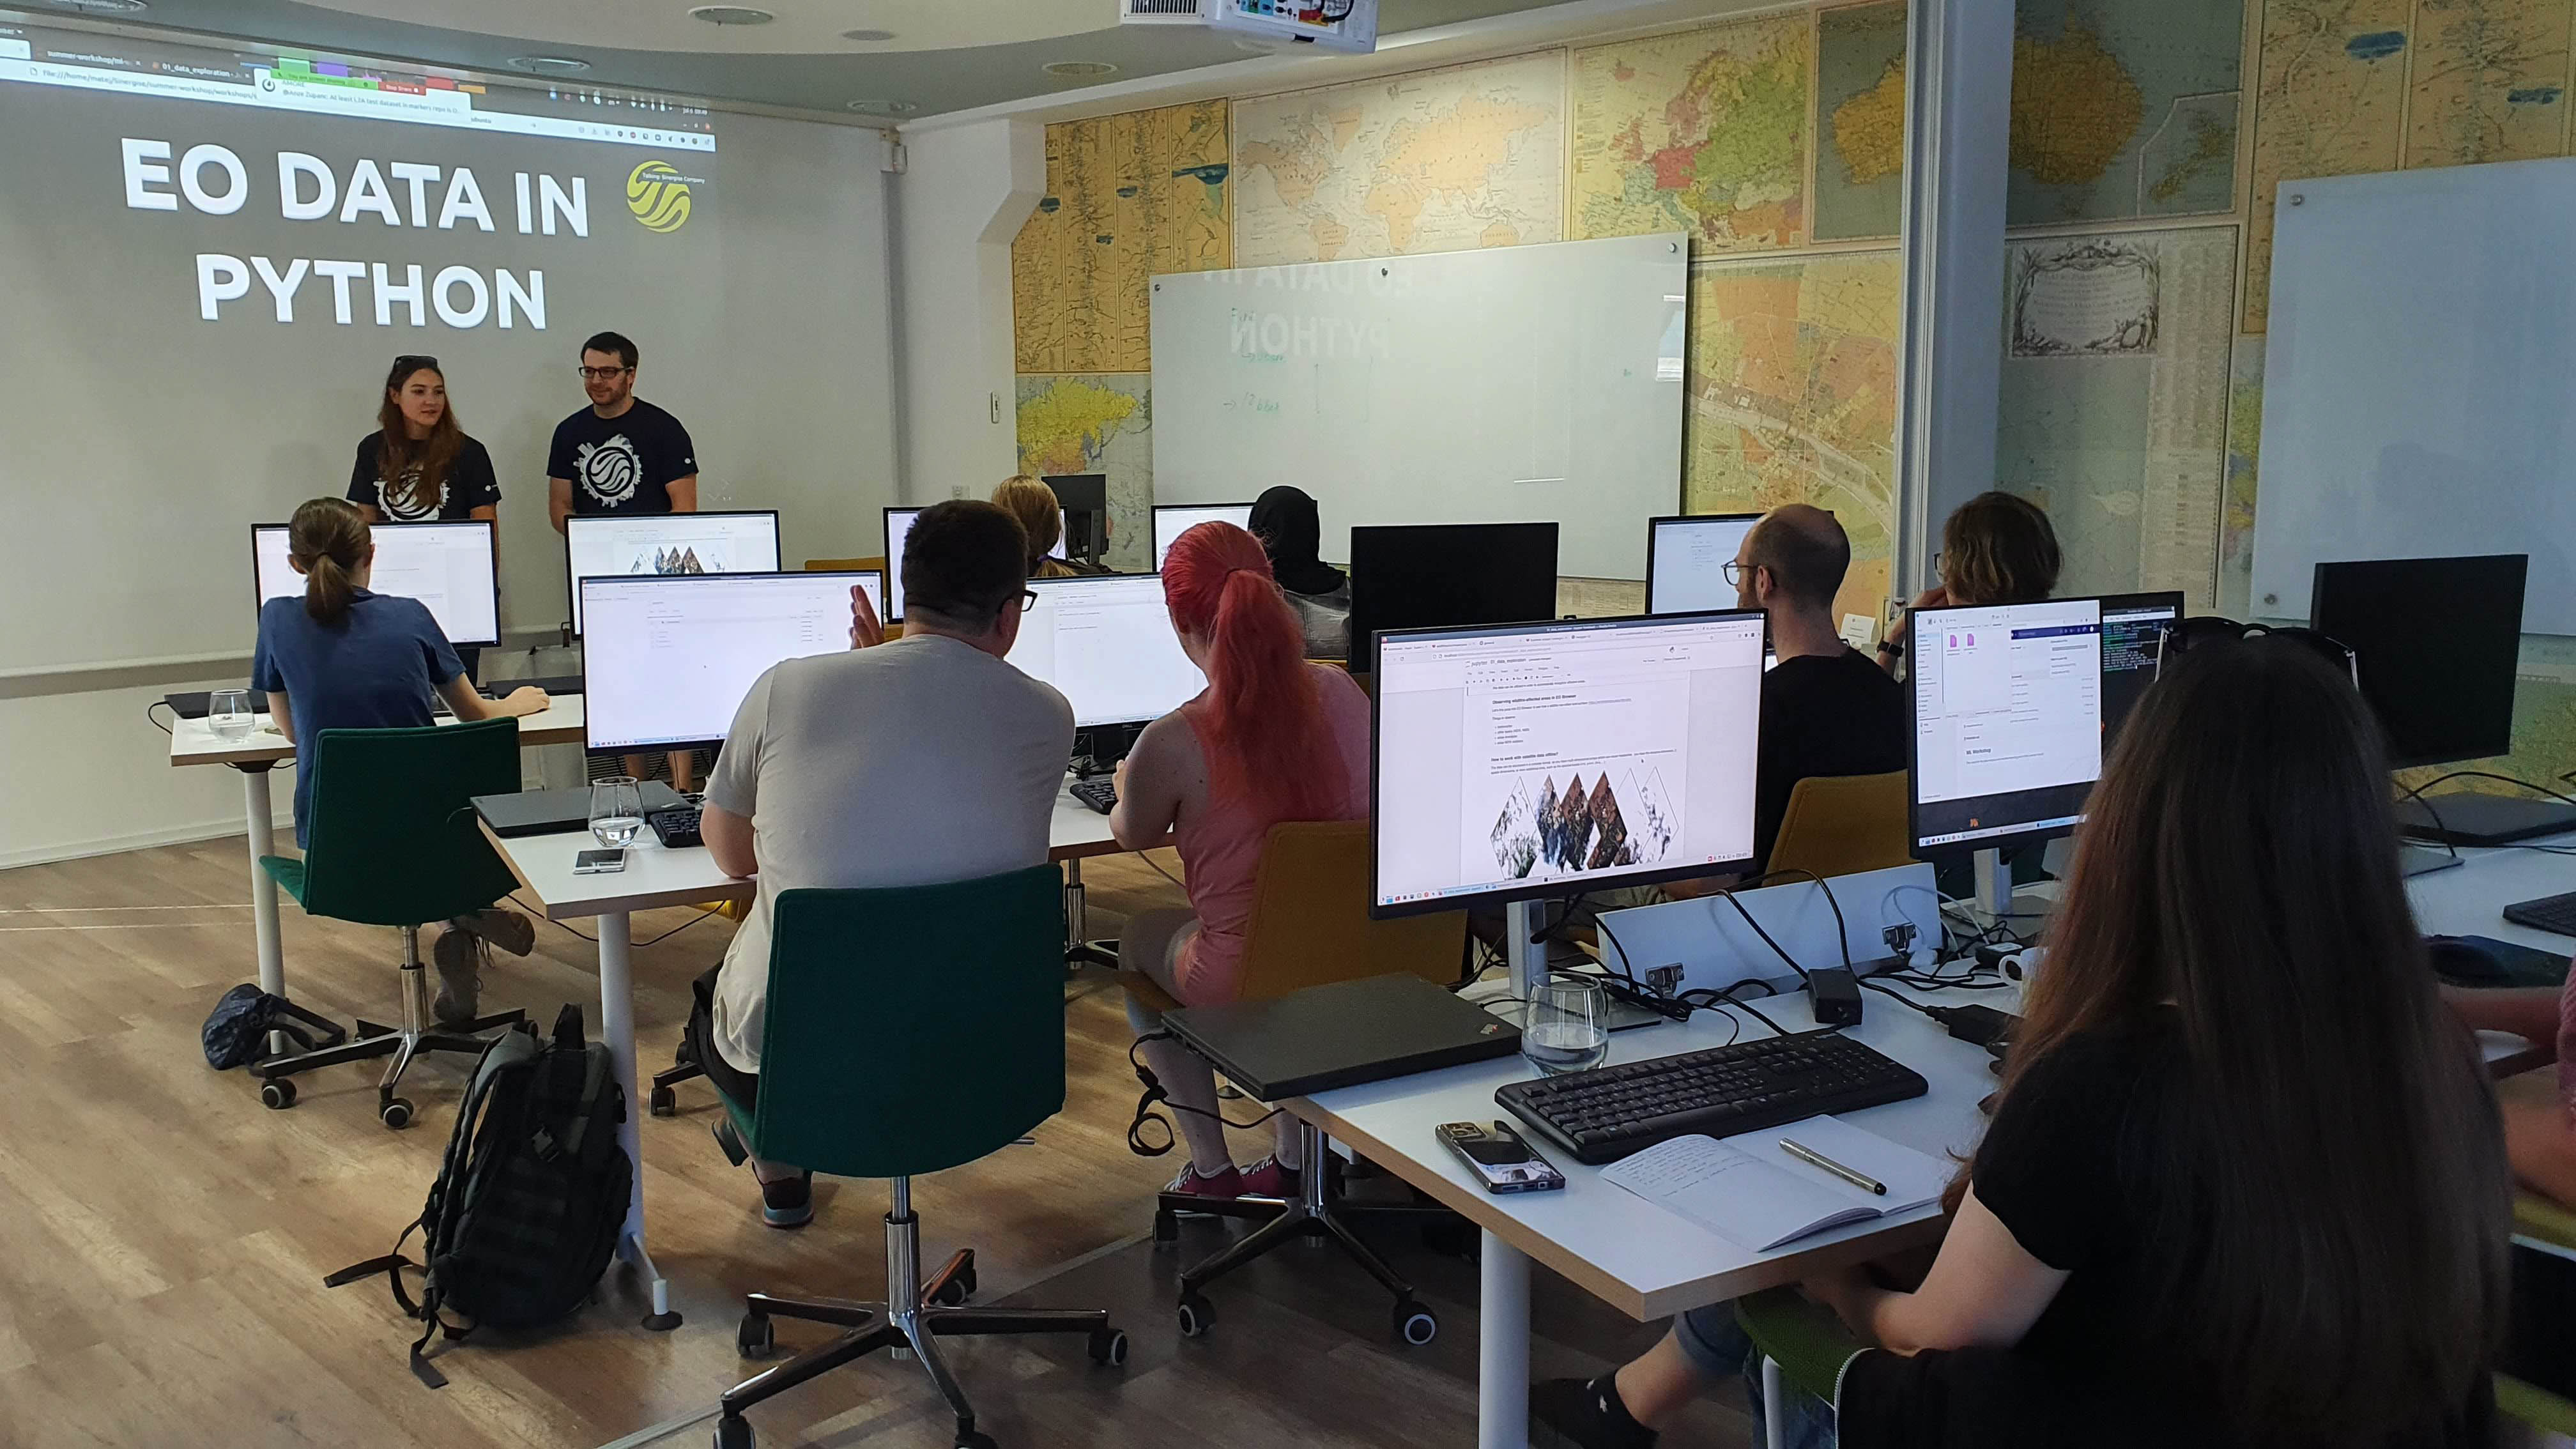
Day 1 - Introduction to Earth Observation and Scaling workloads in the cloud
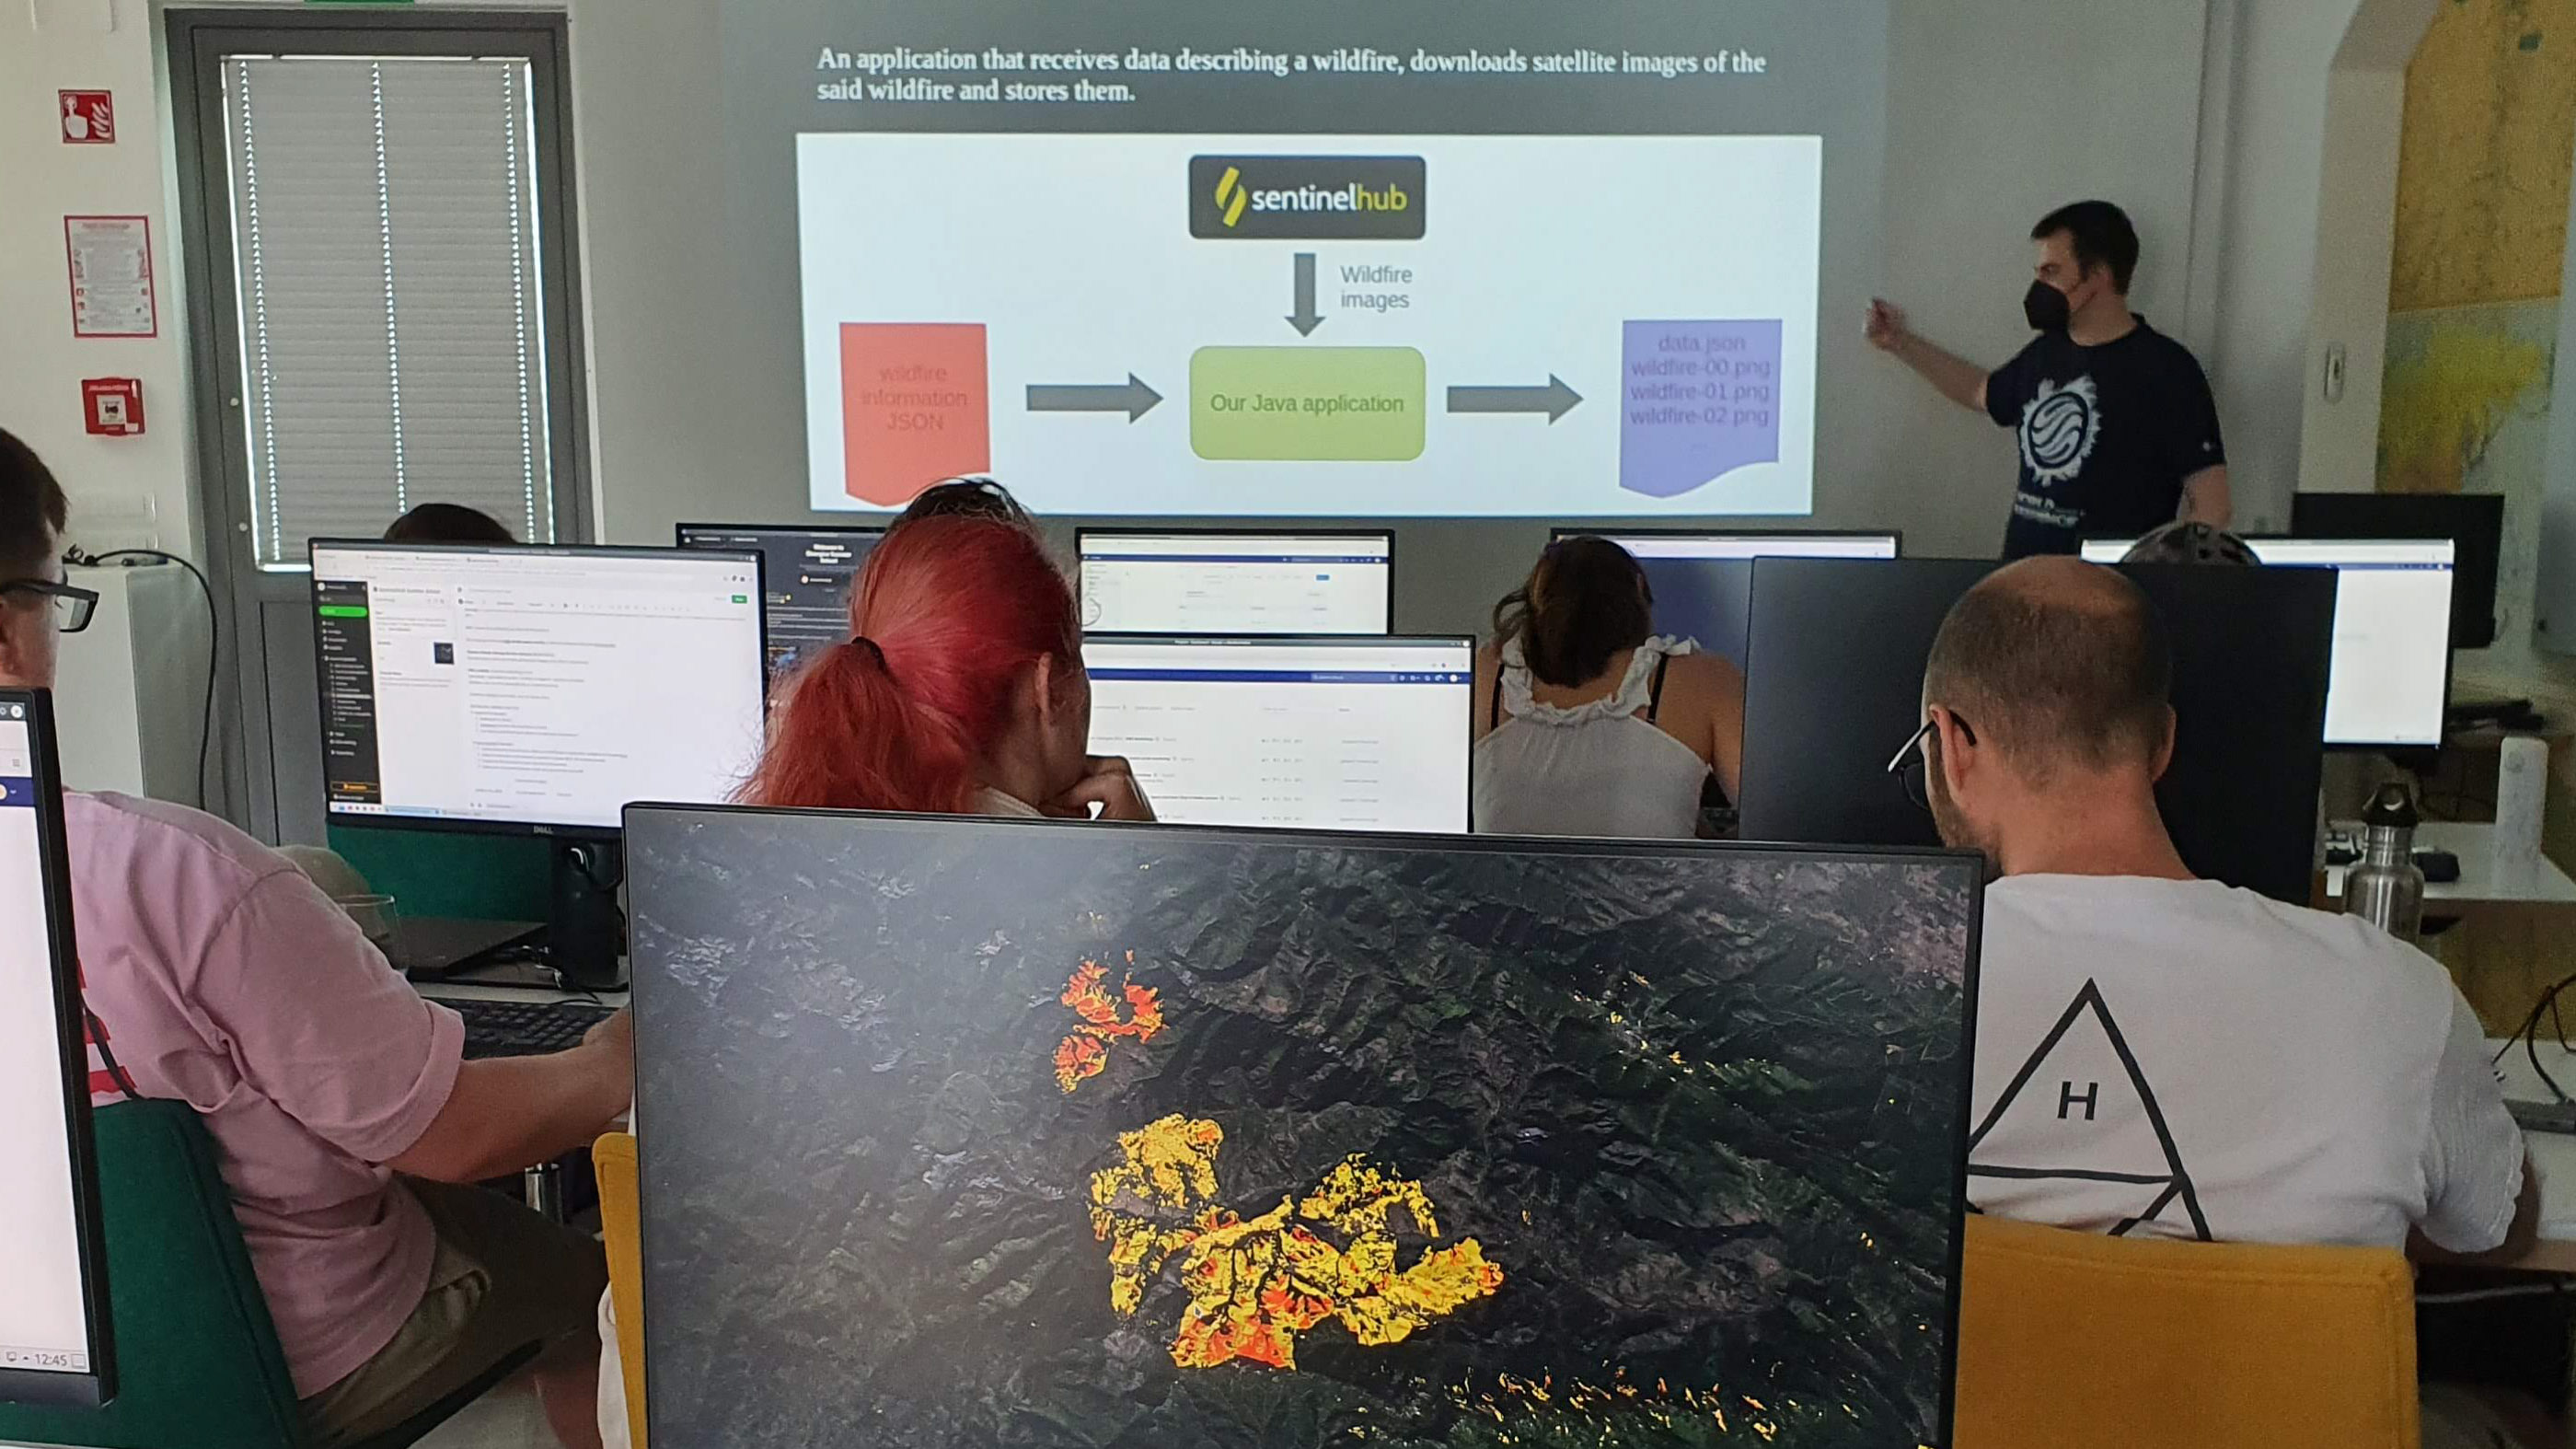
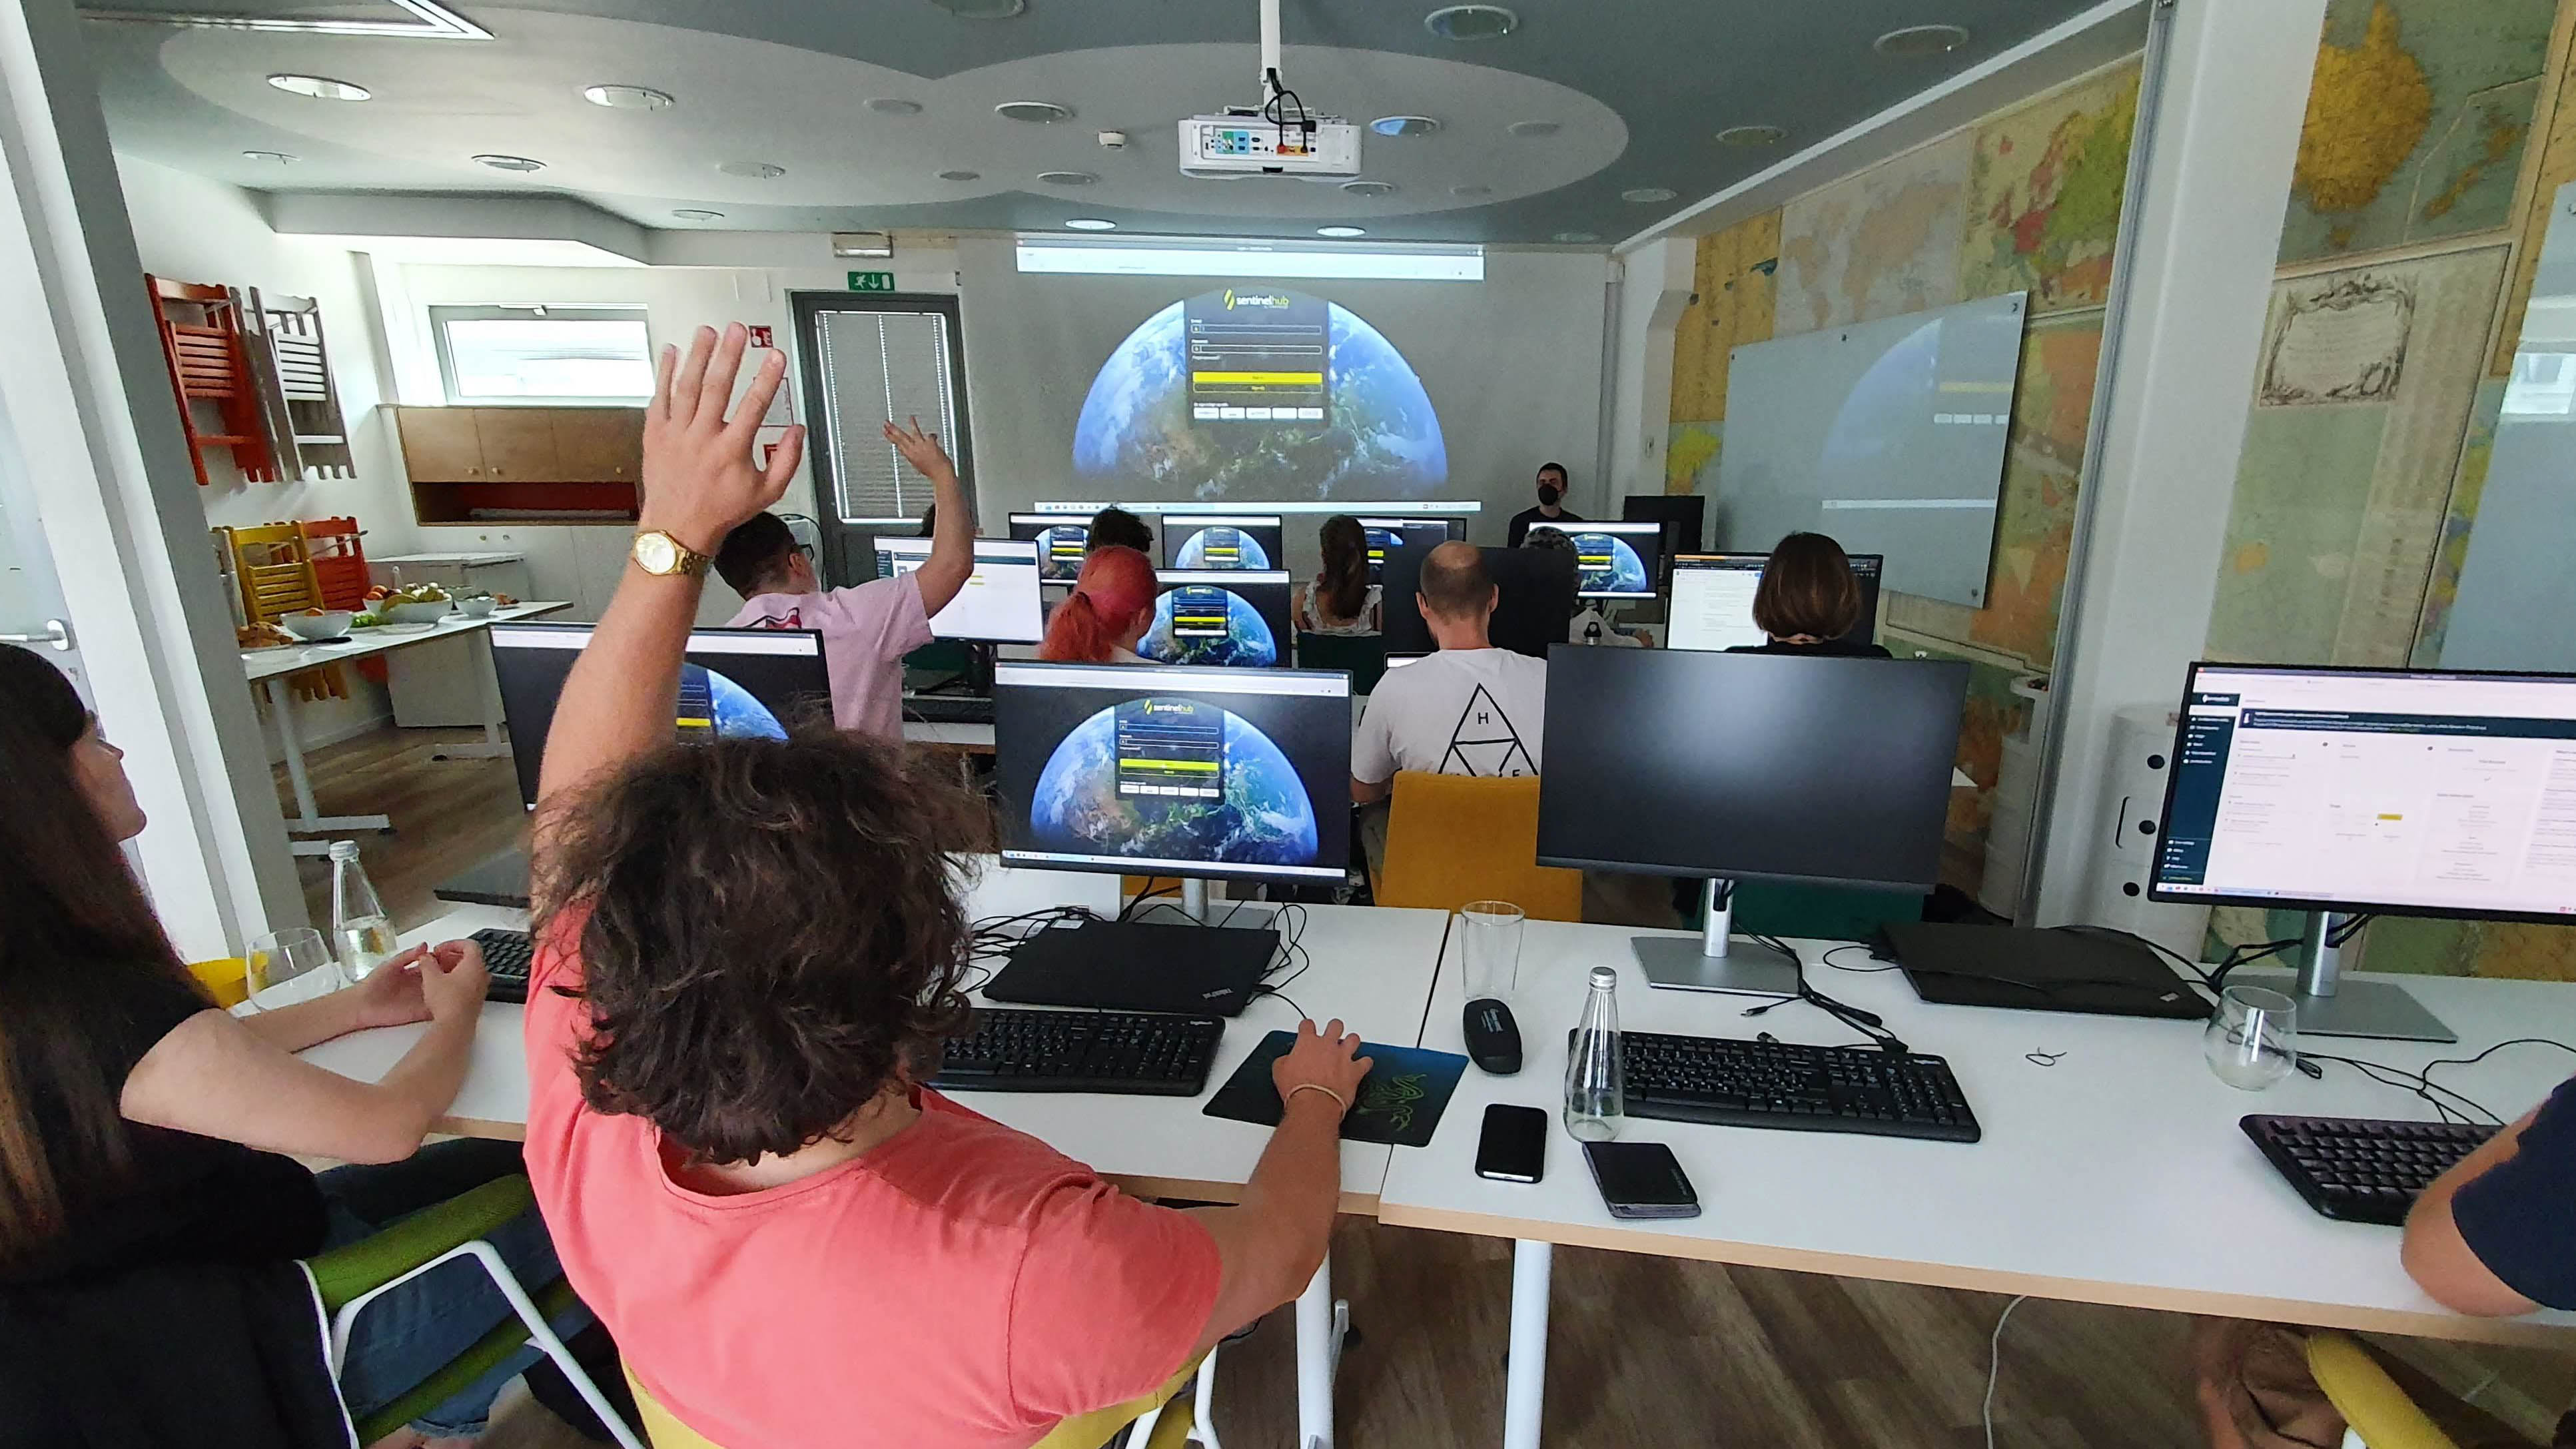
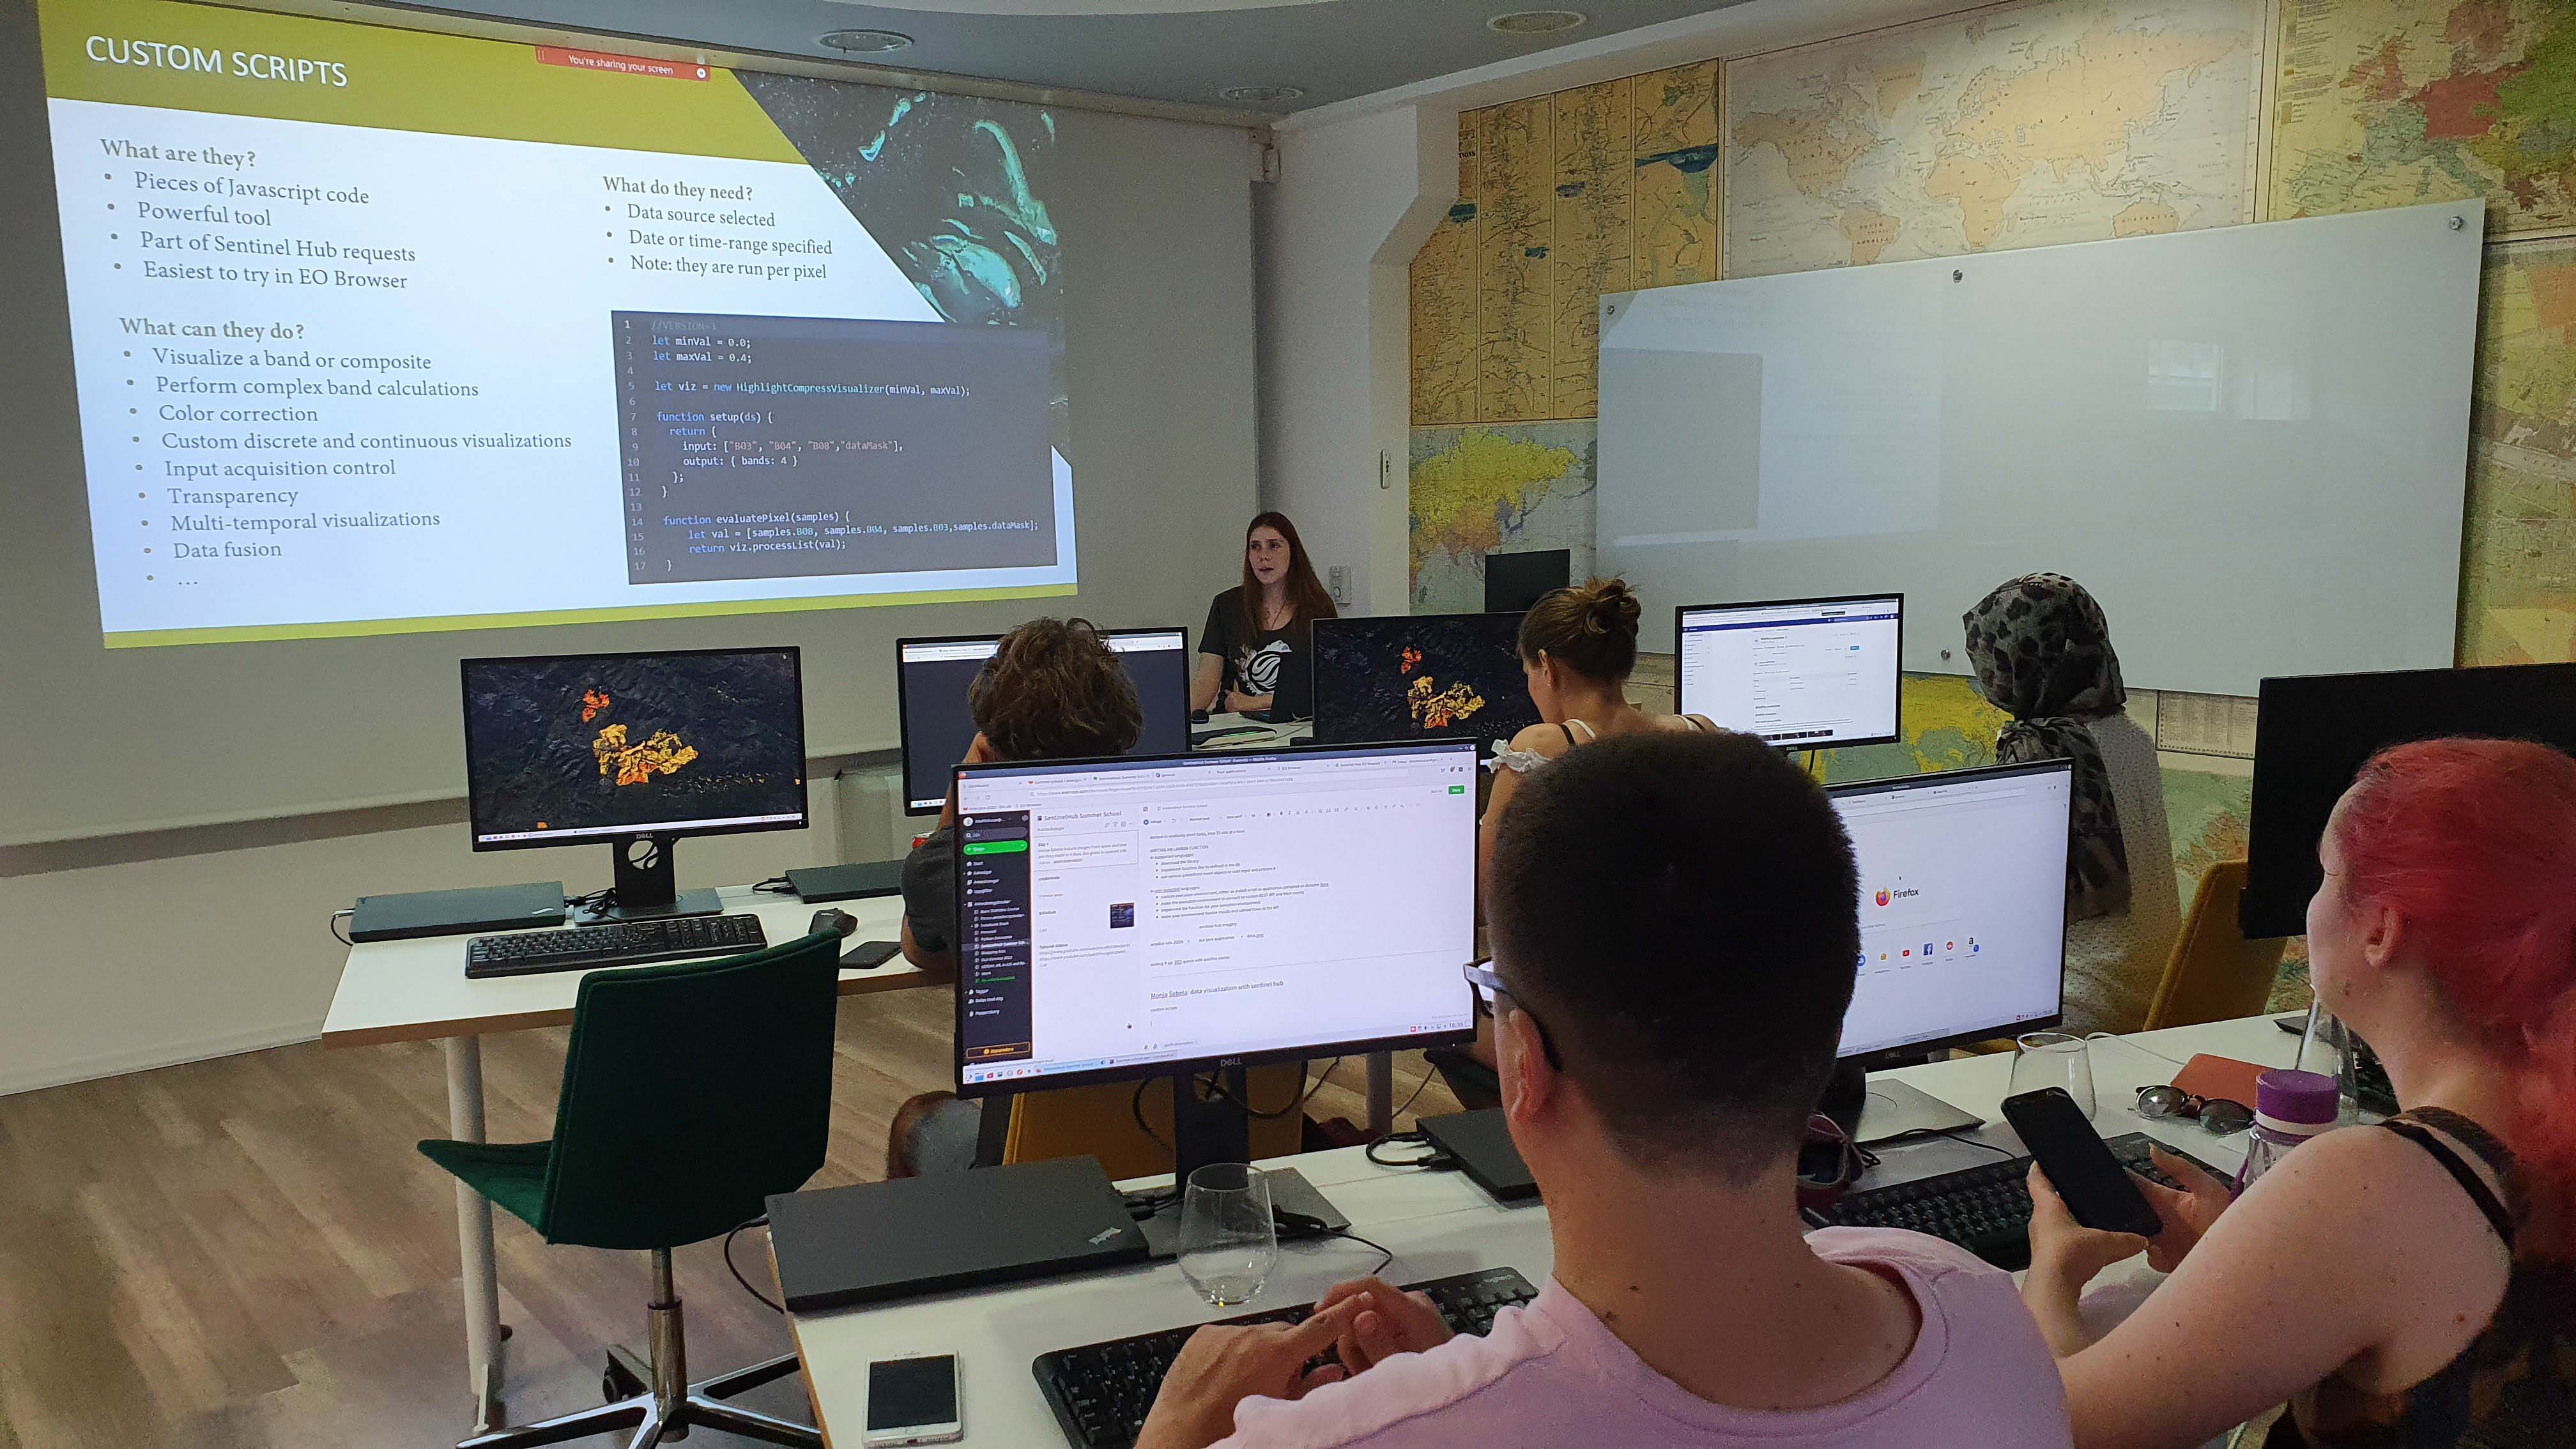
Our Summer School started with the basics of Earth observation, so participants became familiar with satellite bands and learned how to create RGB composites to visualise the impact of wildfires. Next, we looked at how to write a simple Java application that takes some data about past wildfires and downloads satellite images of them from Sentinel Hub. To make our application scalable, we turned it into an AWS Lambda function that reads input from an SQS queue and writes output to an S3 bucket. Finally, we looked at Sentinel Hub's custom scripts and considered how we could use them to improve our results. The first day ended with exploring different approaches, such as mixing different bands, masking out clouds and using multiple acquisitions at the same time.

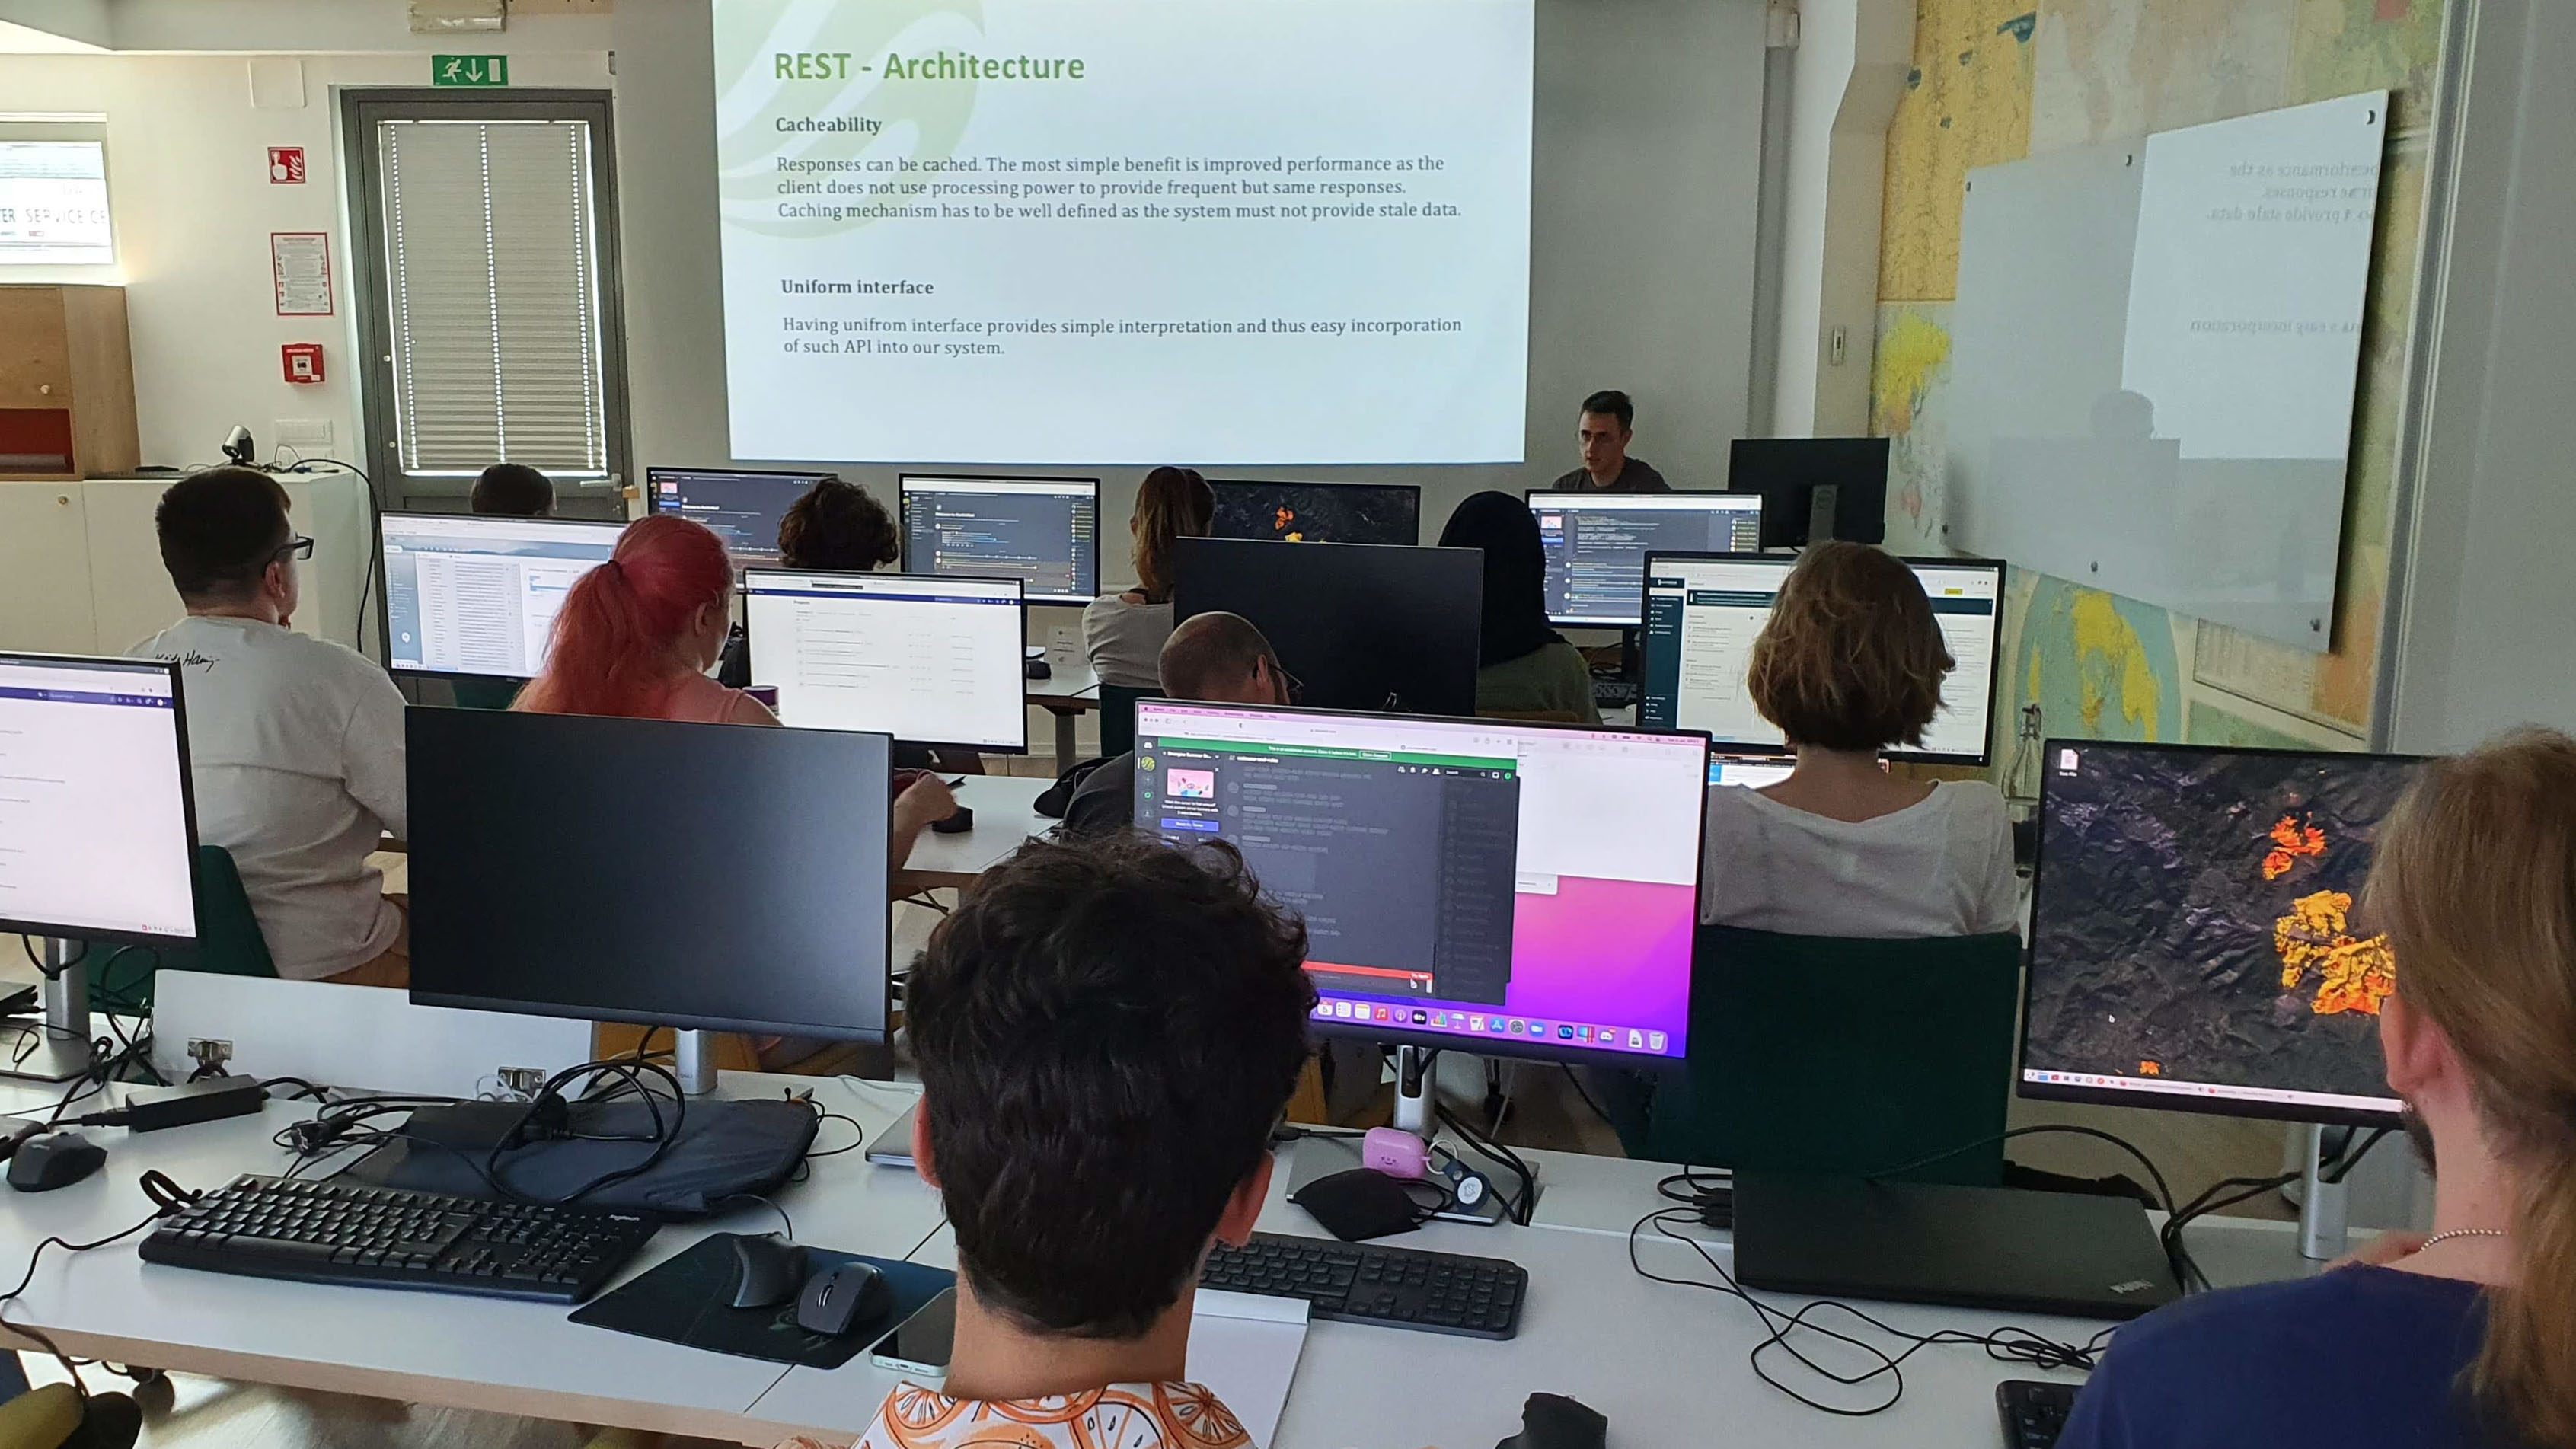
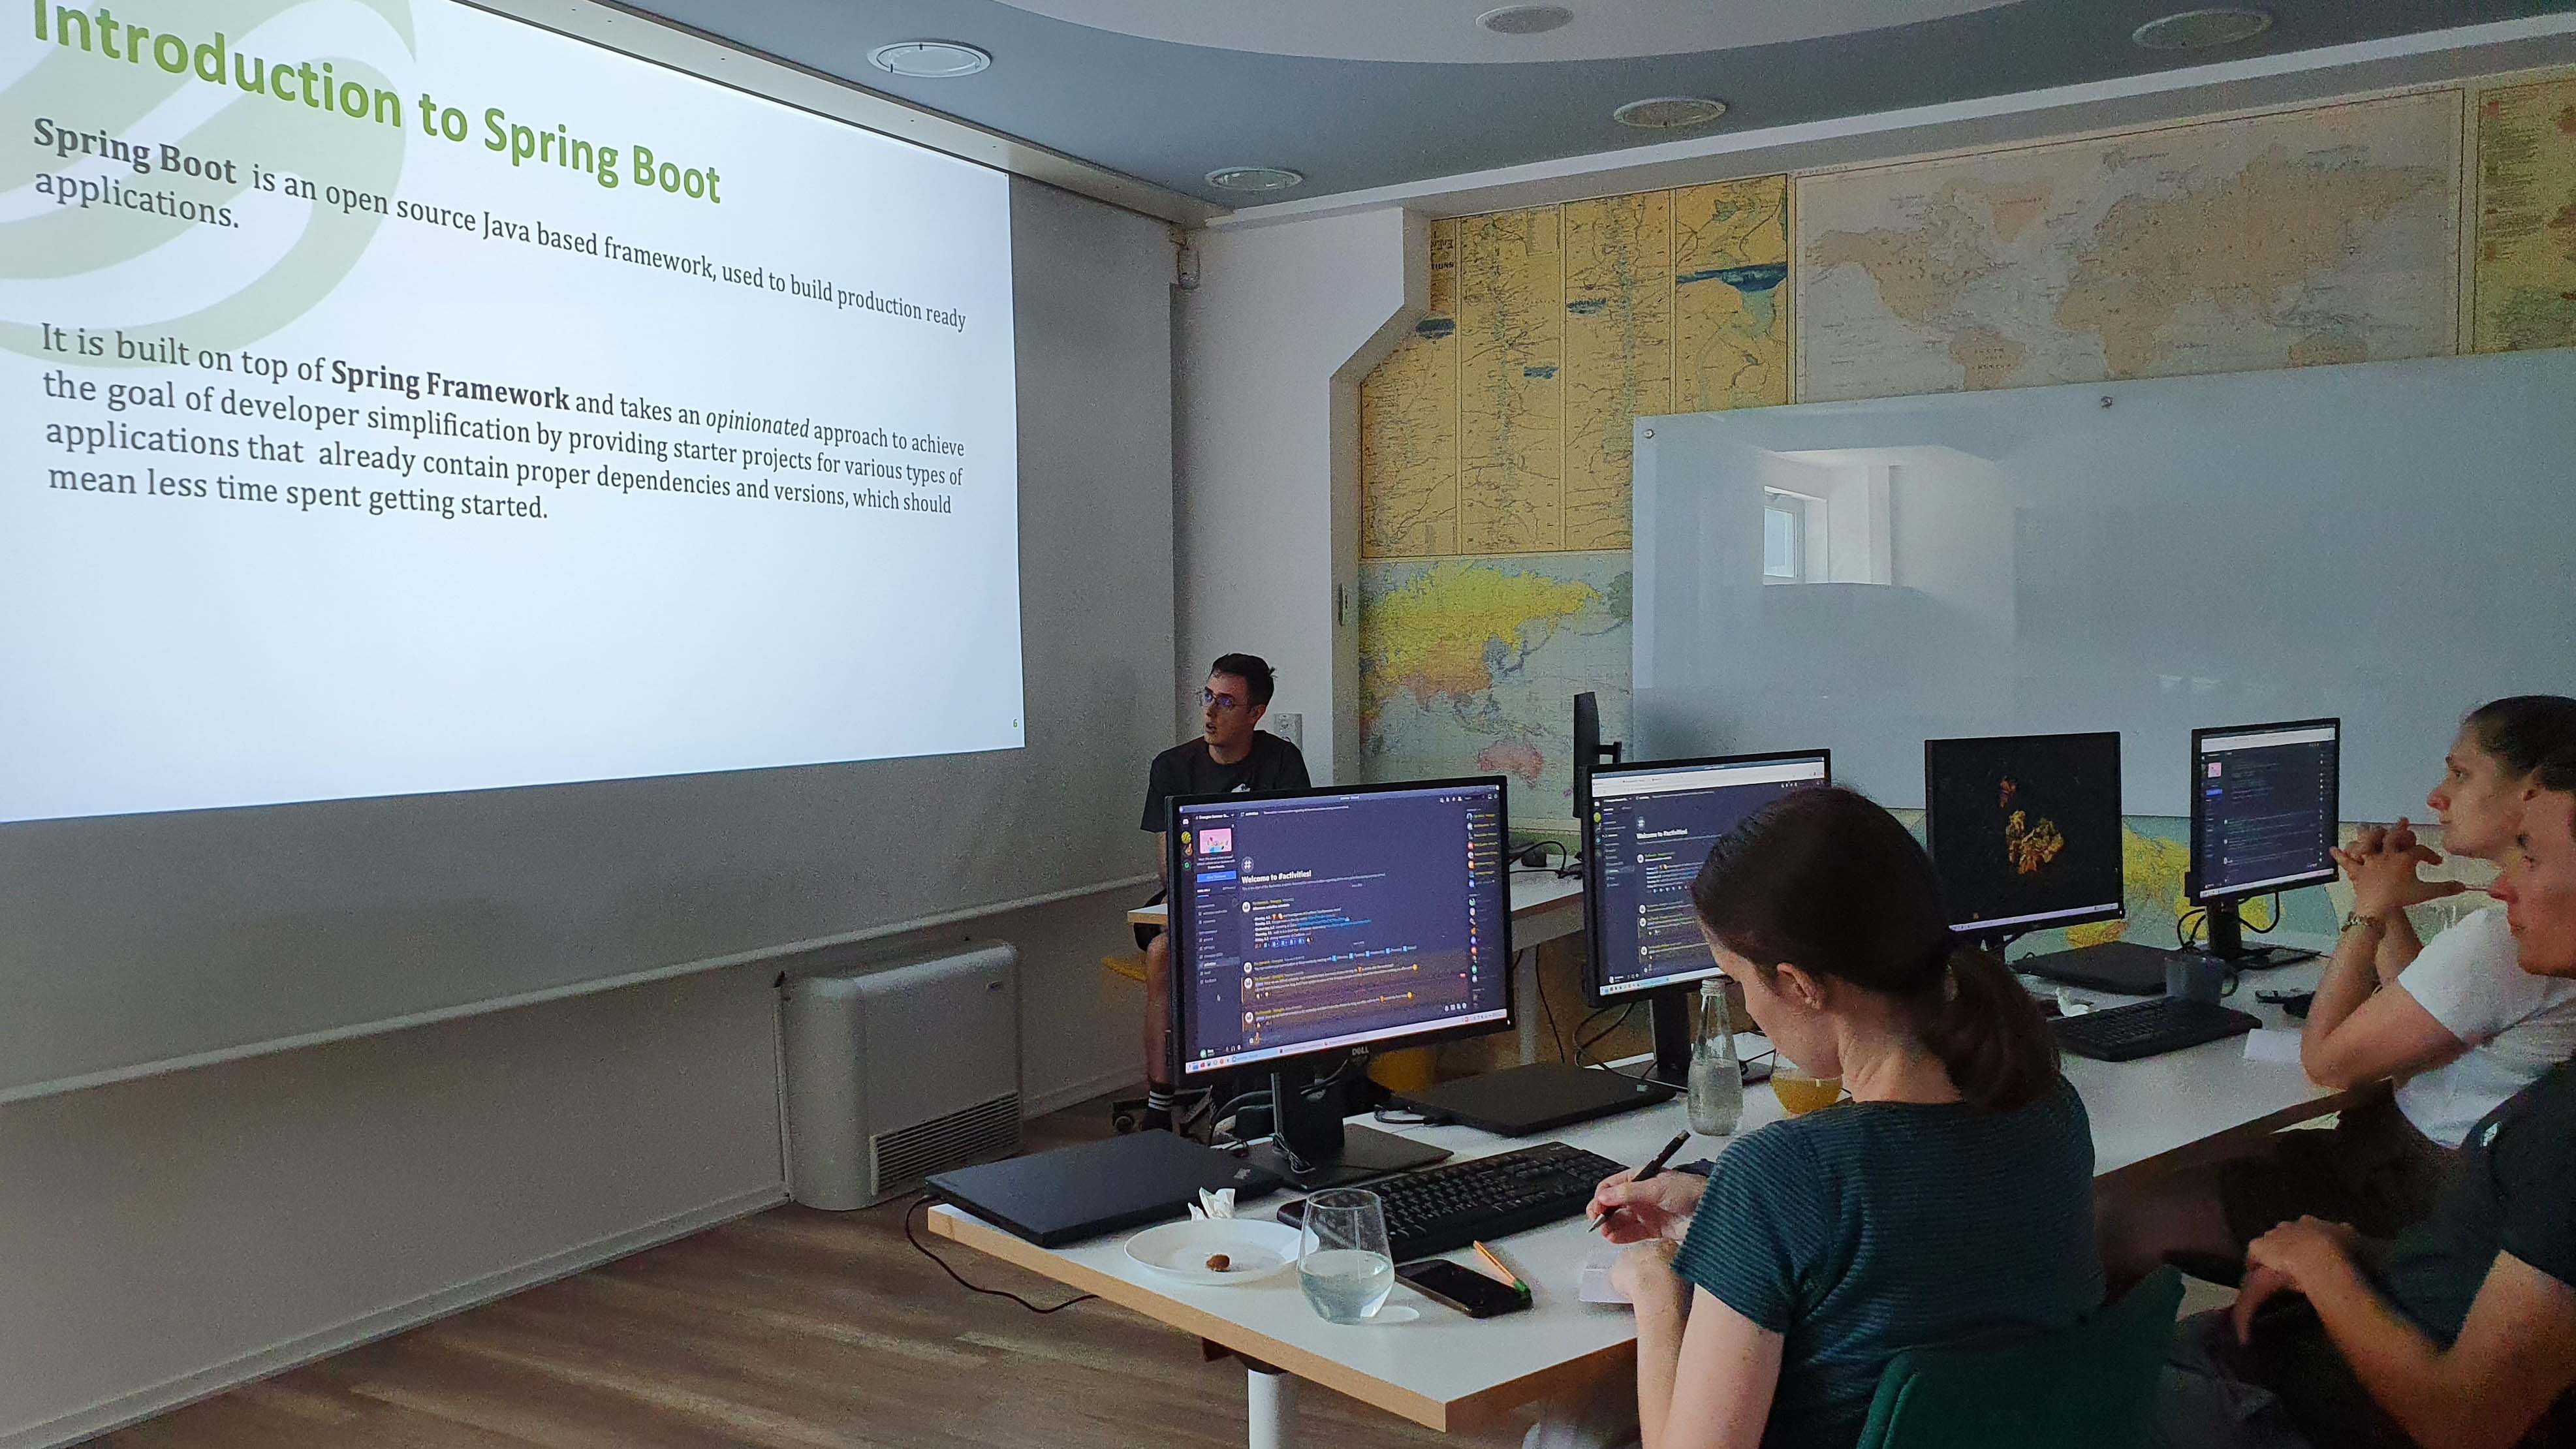
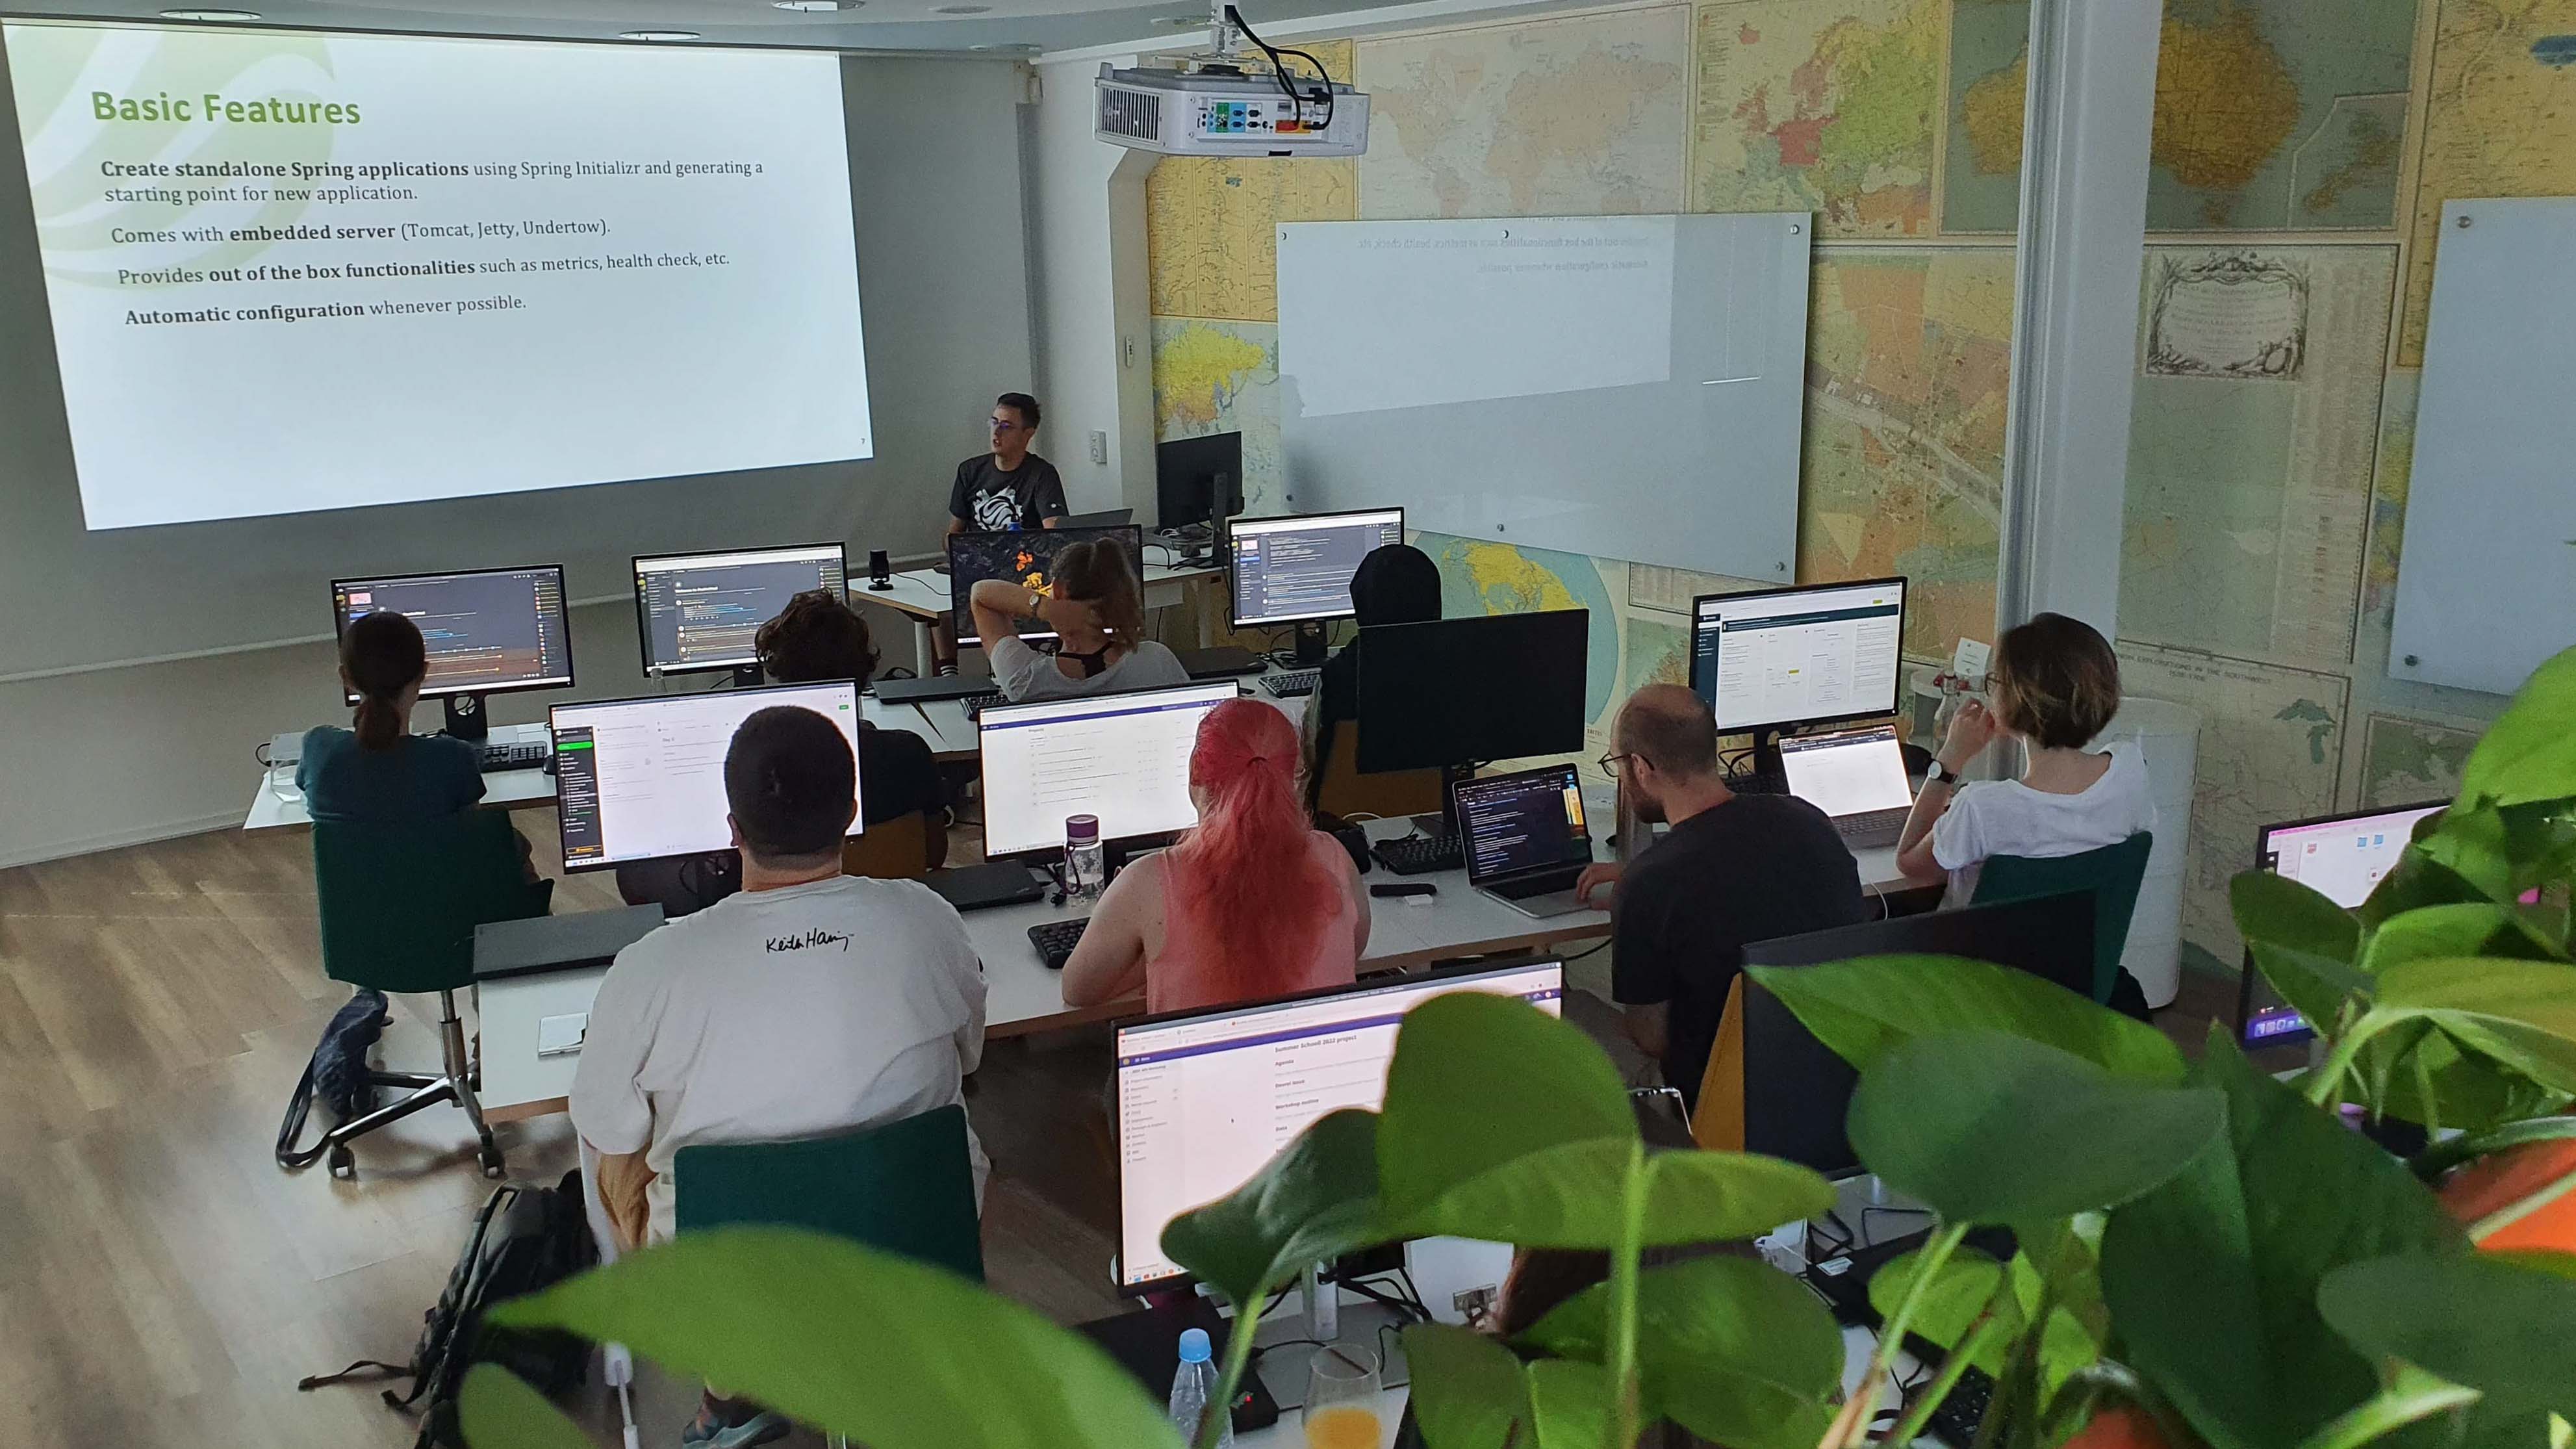
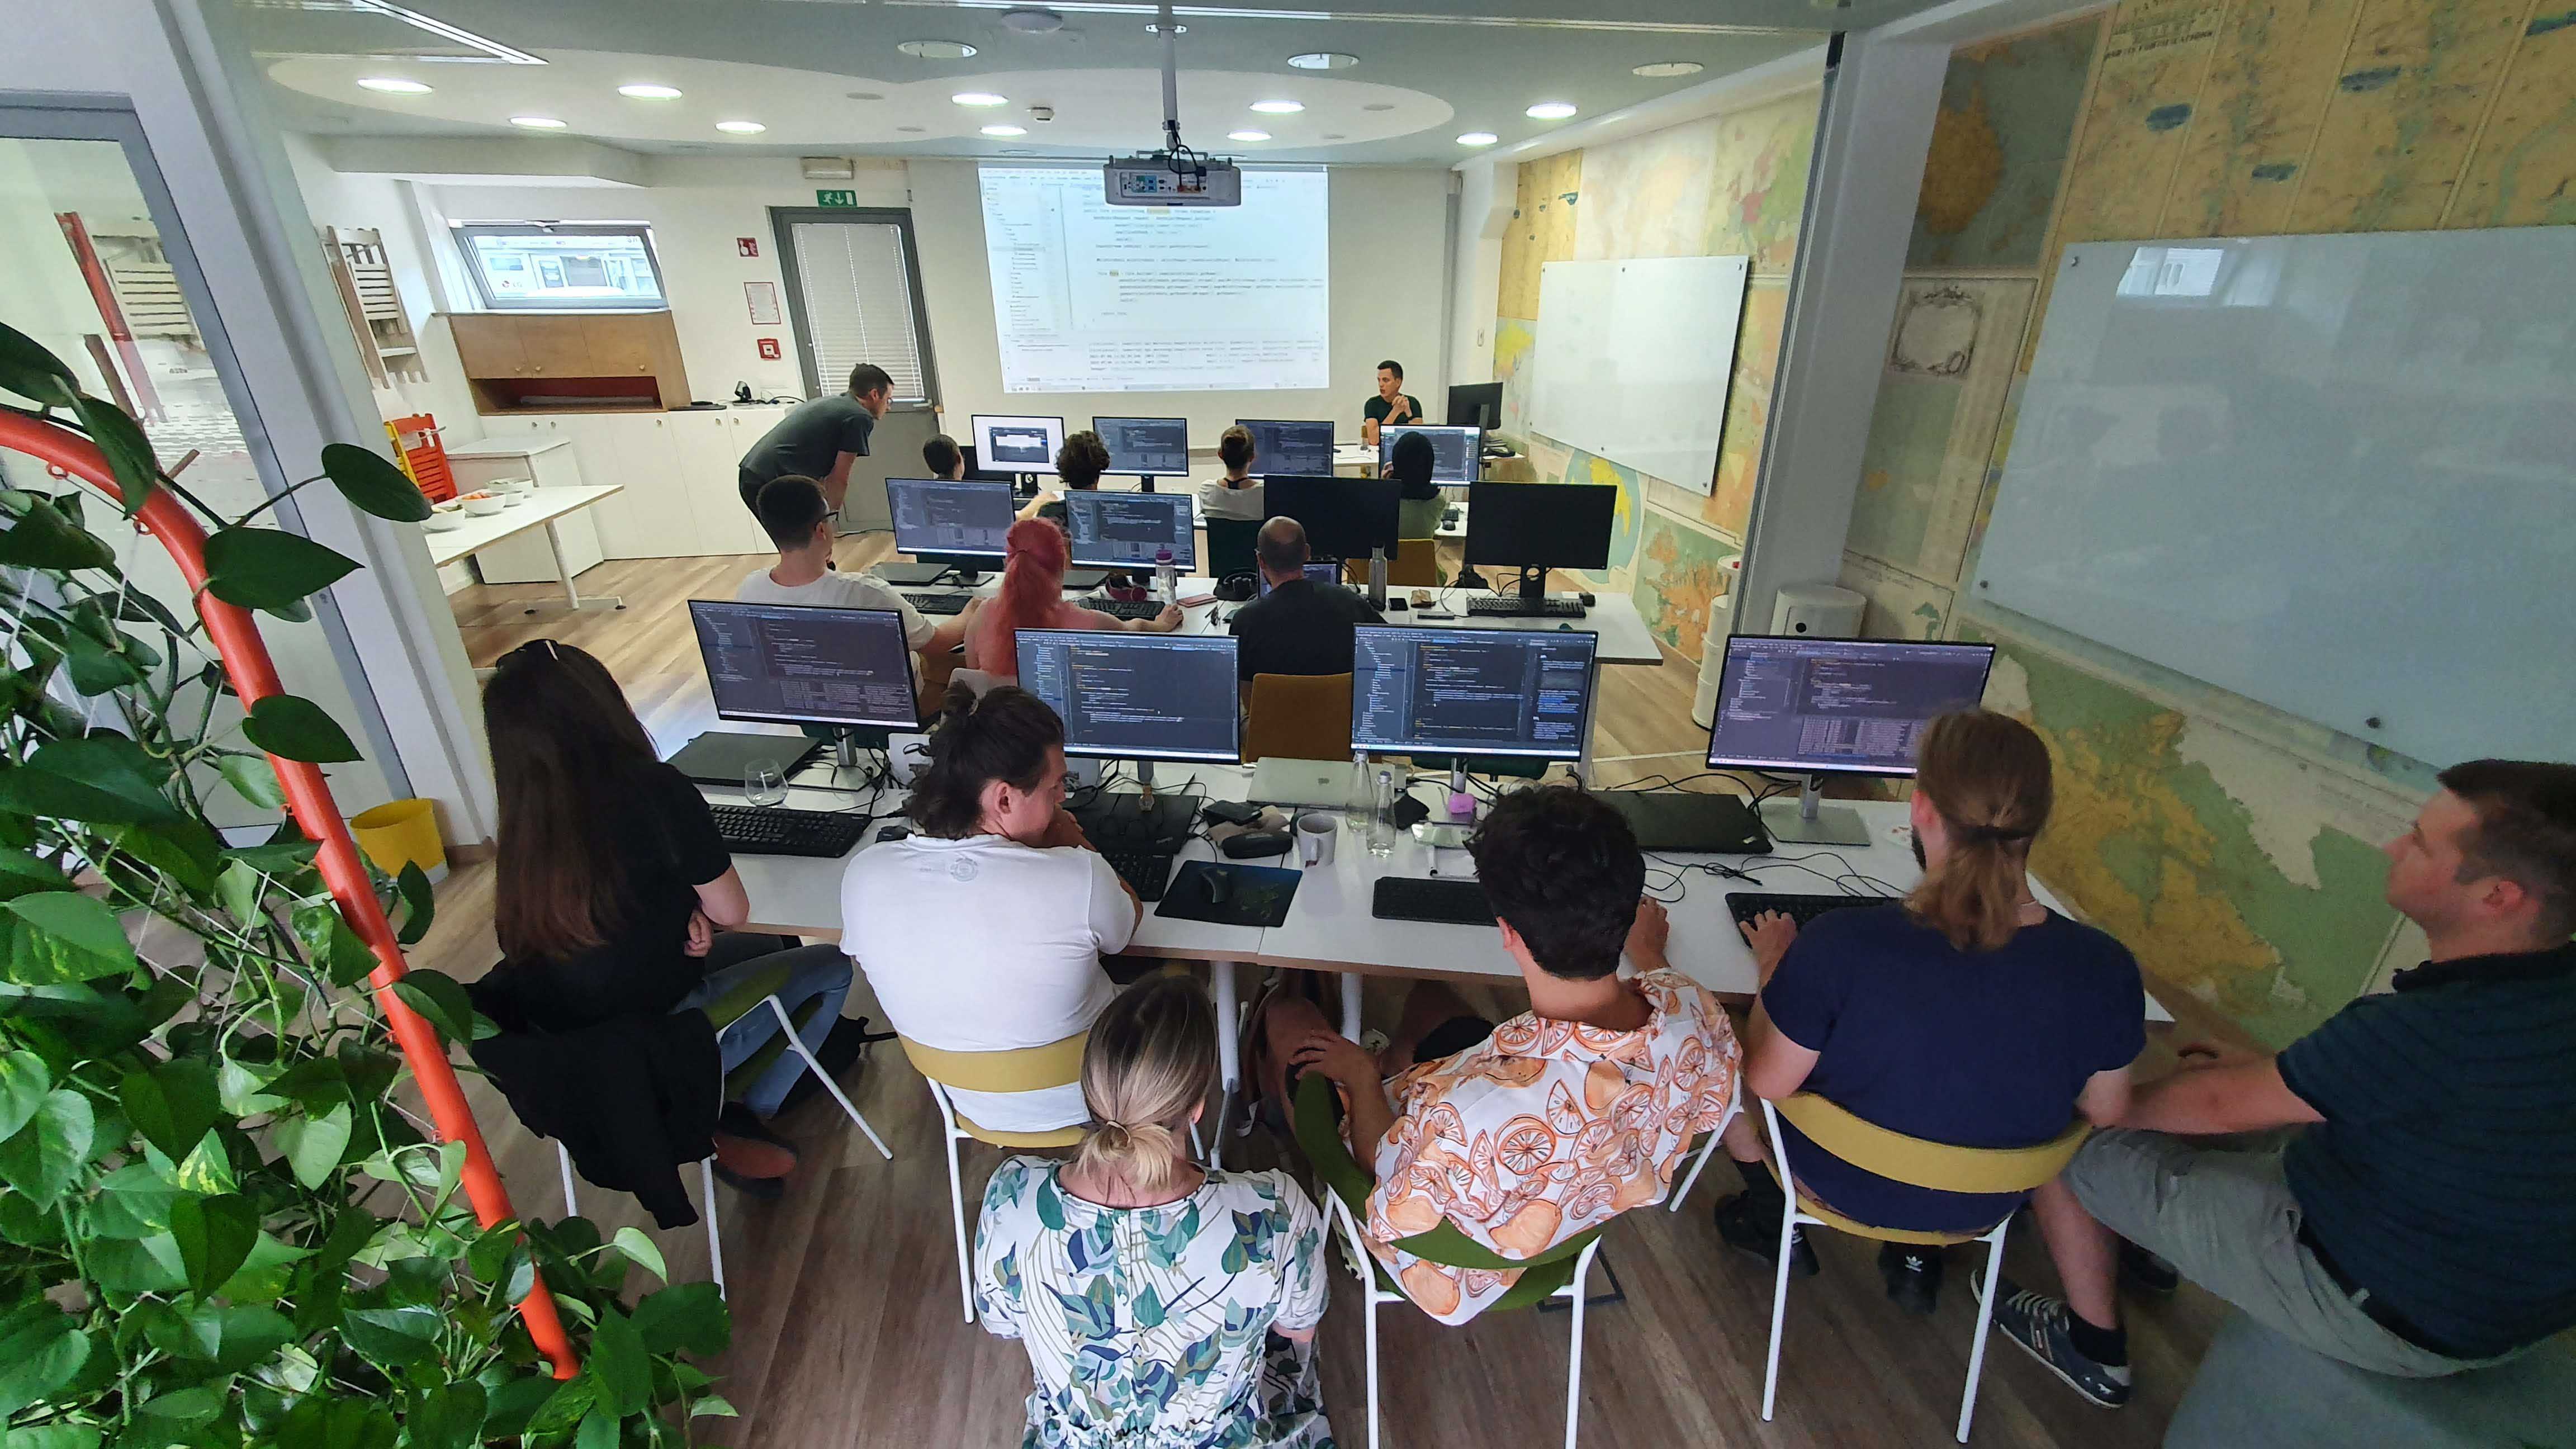
Day 2 - Providing and managing data with RESTful web services
The second day was dedicated to the Spring Boot framework and learning how it can help us build RESTful services. A new resource with test data was added and automatically integrated with our database and persistence layer and made accessible through our REST API. We then also added some custom endpoints to retrieve our data via BBOX or search query parameters. The learning session ended with a demonstration of how we can easily use Spring Boot to create a production-ready ETL process that can scale as our data grows.
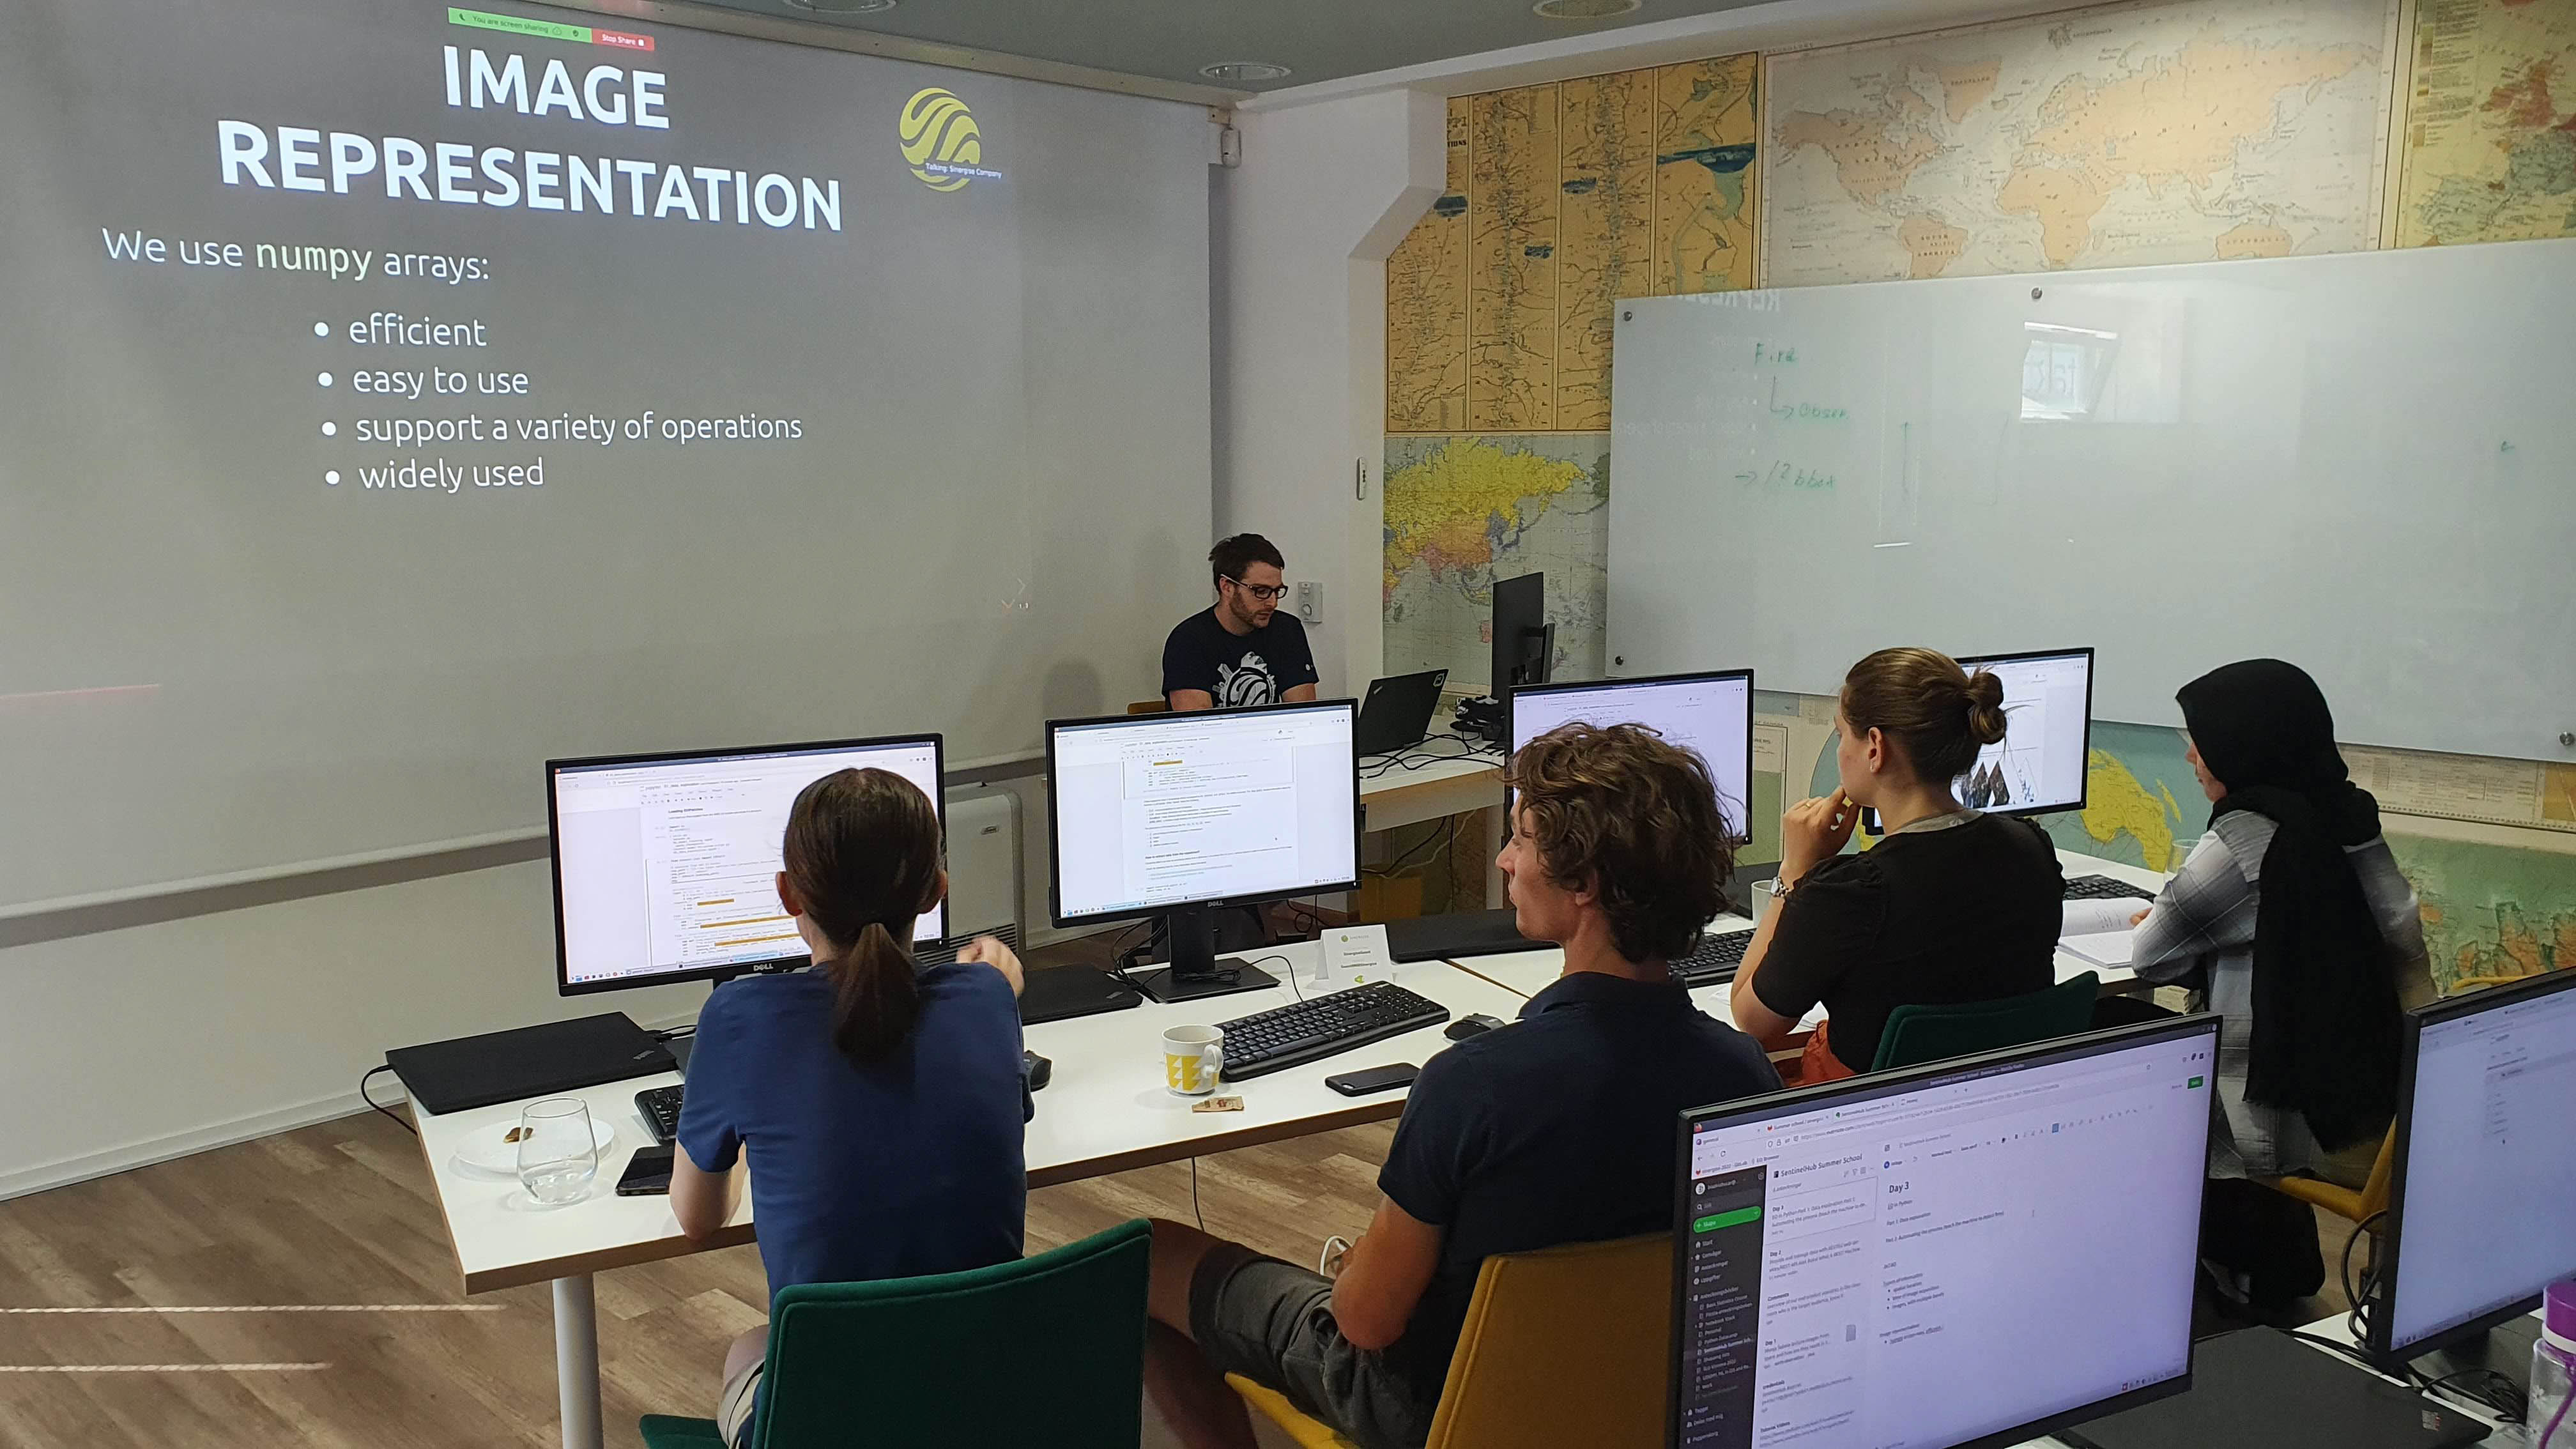
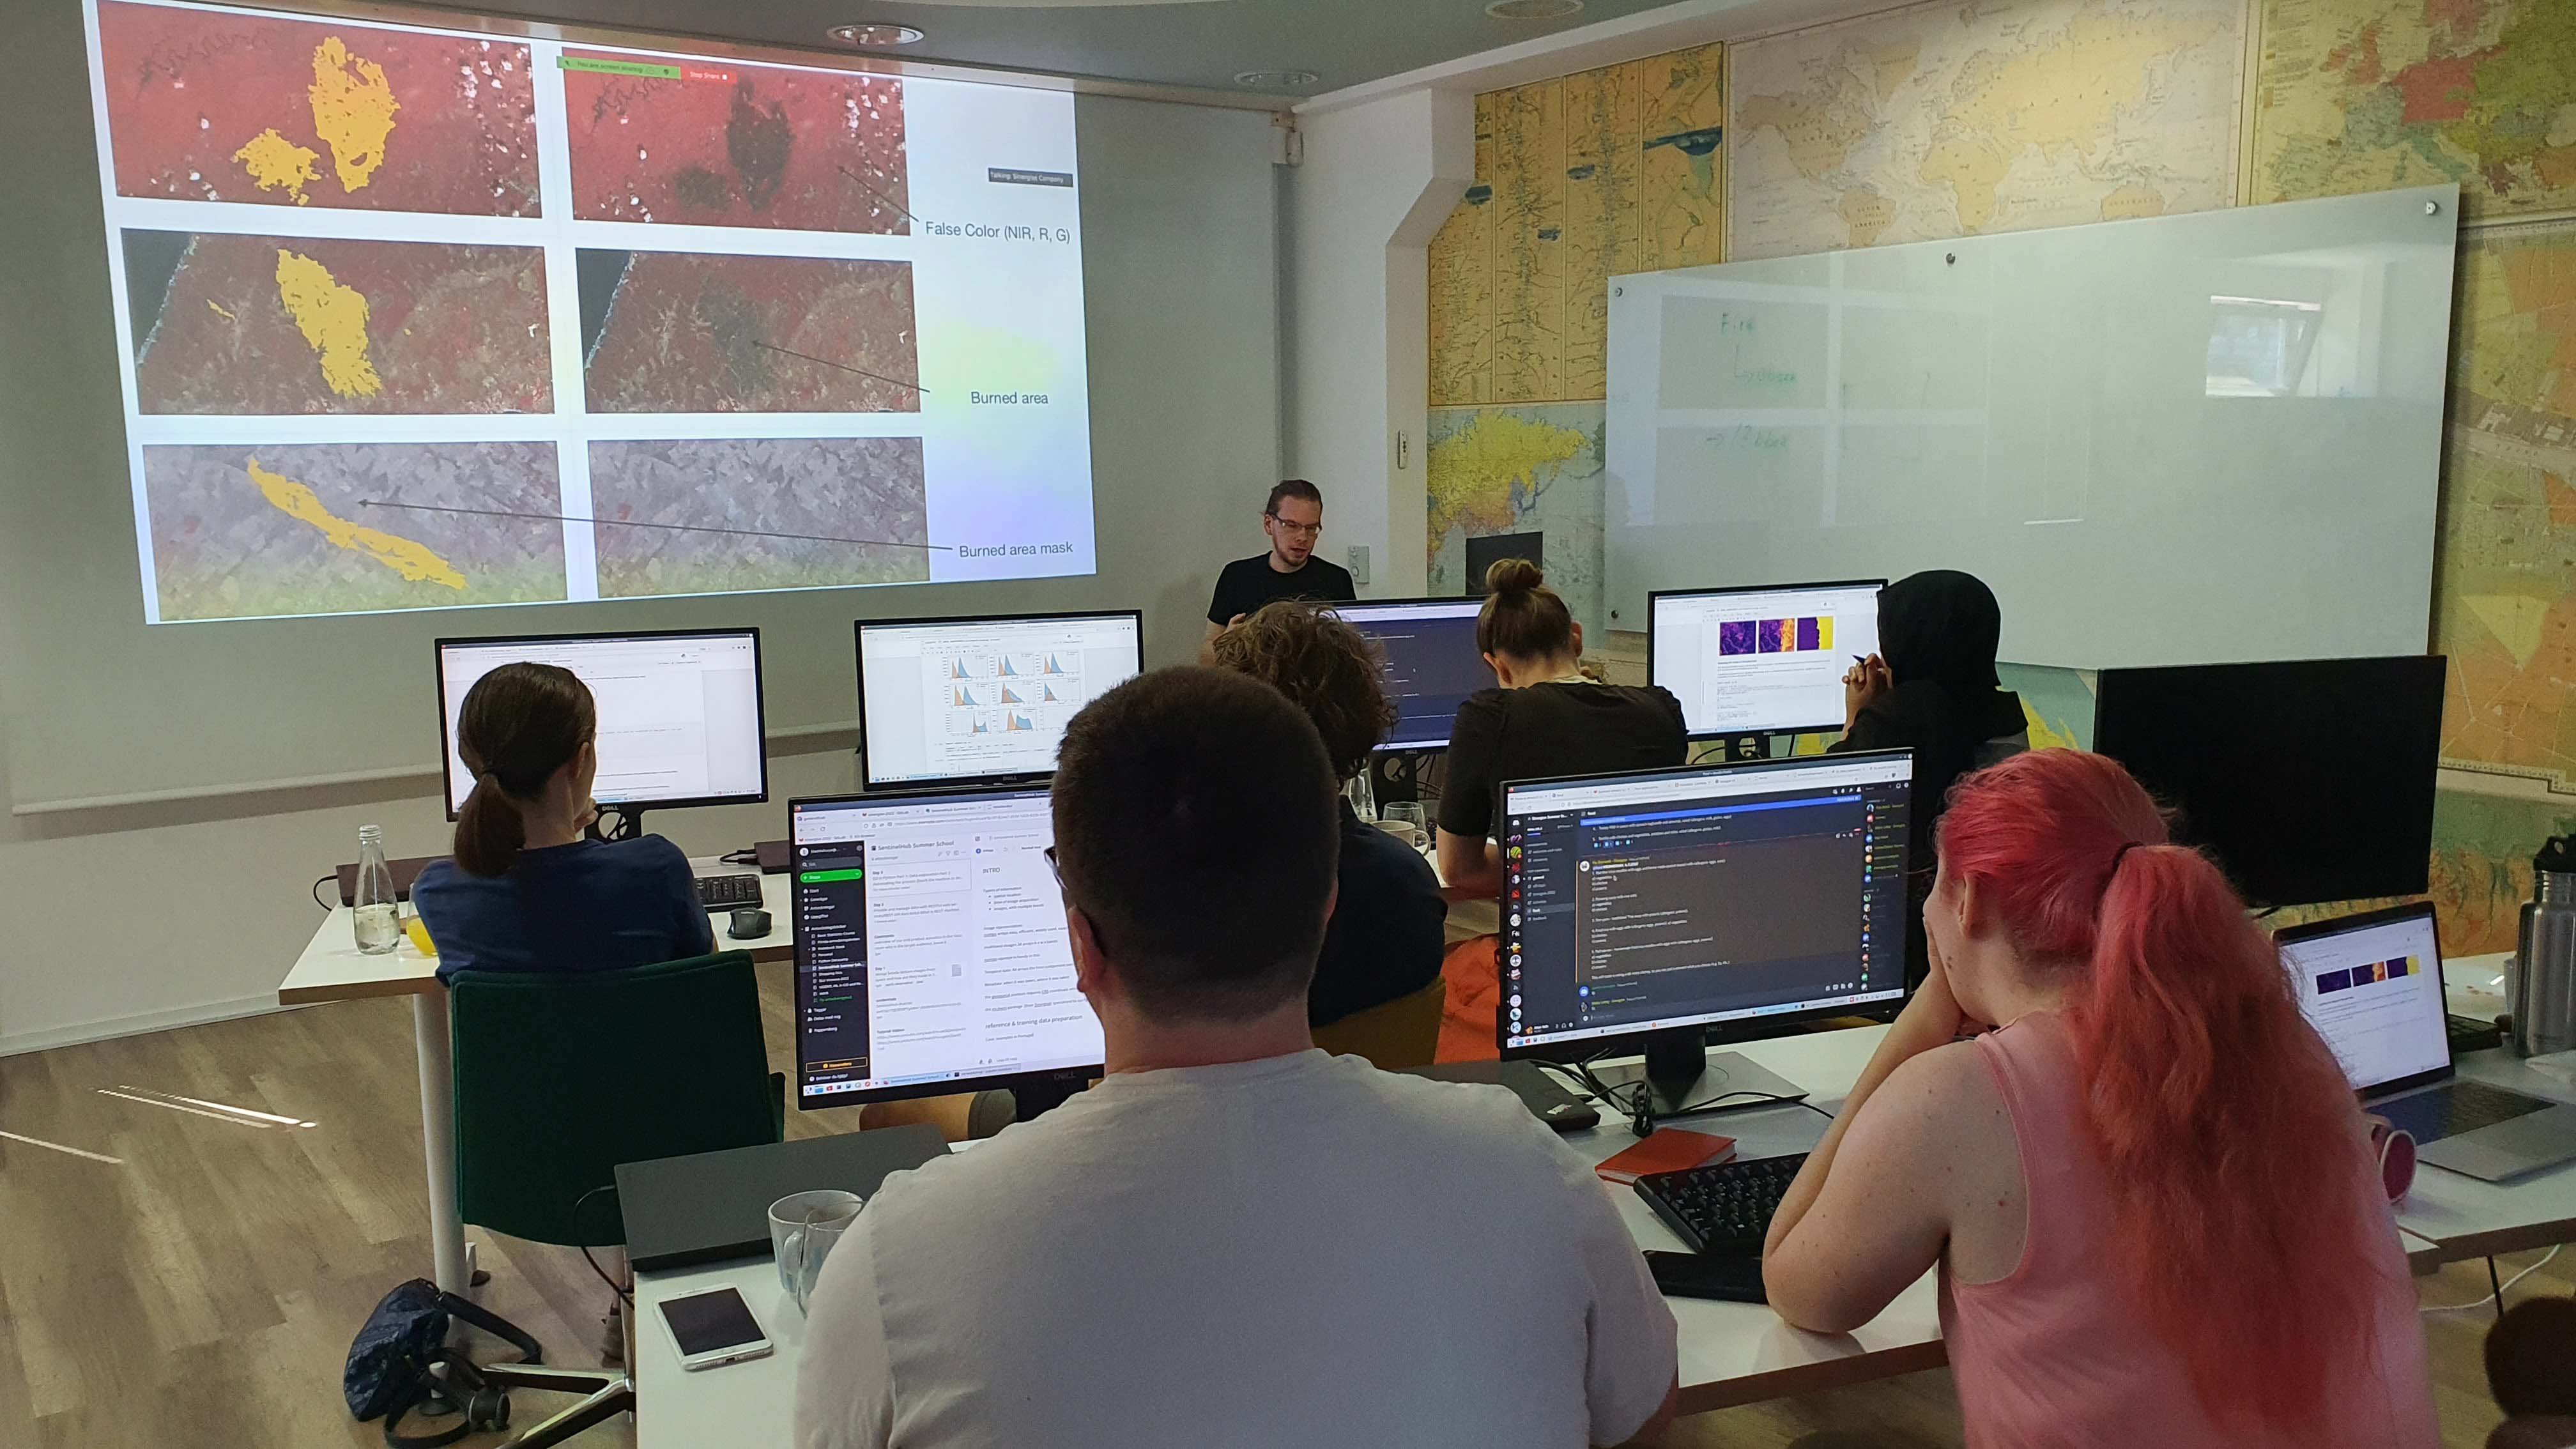
Day 3 - Burned area classification using machine learning
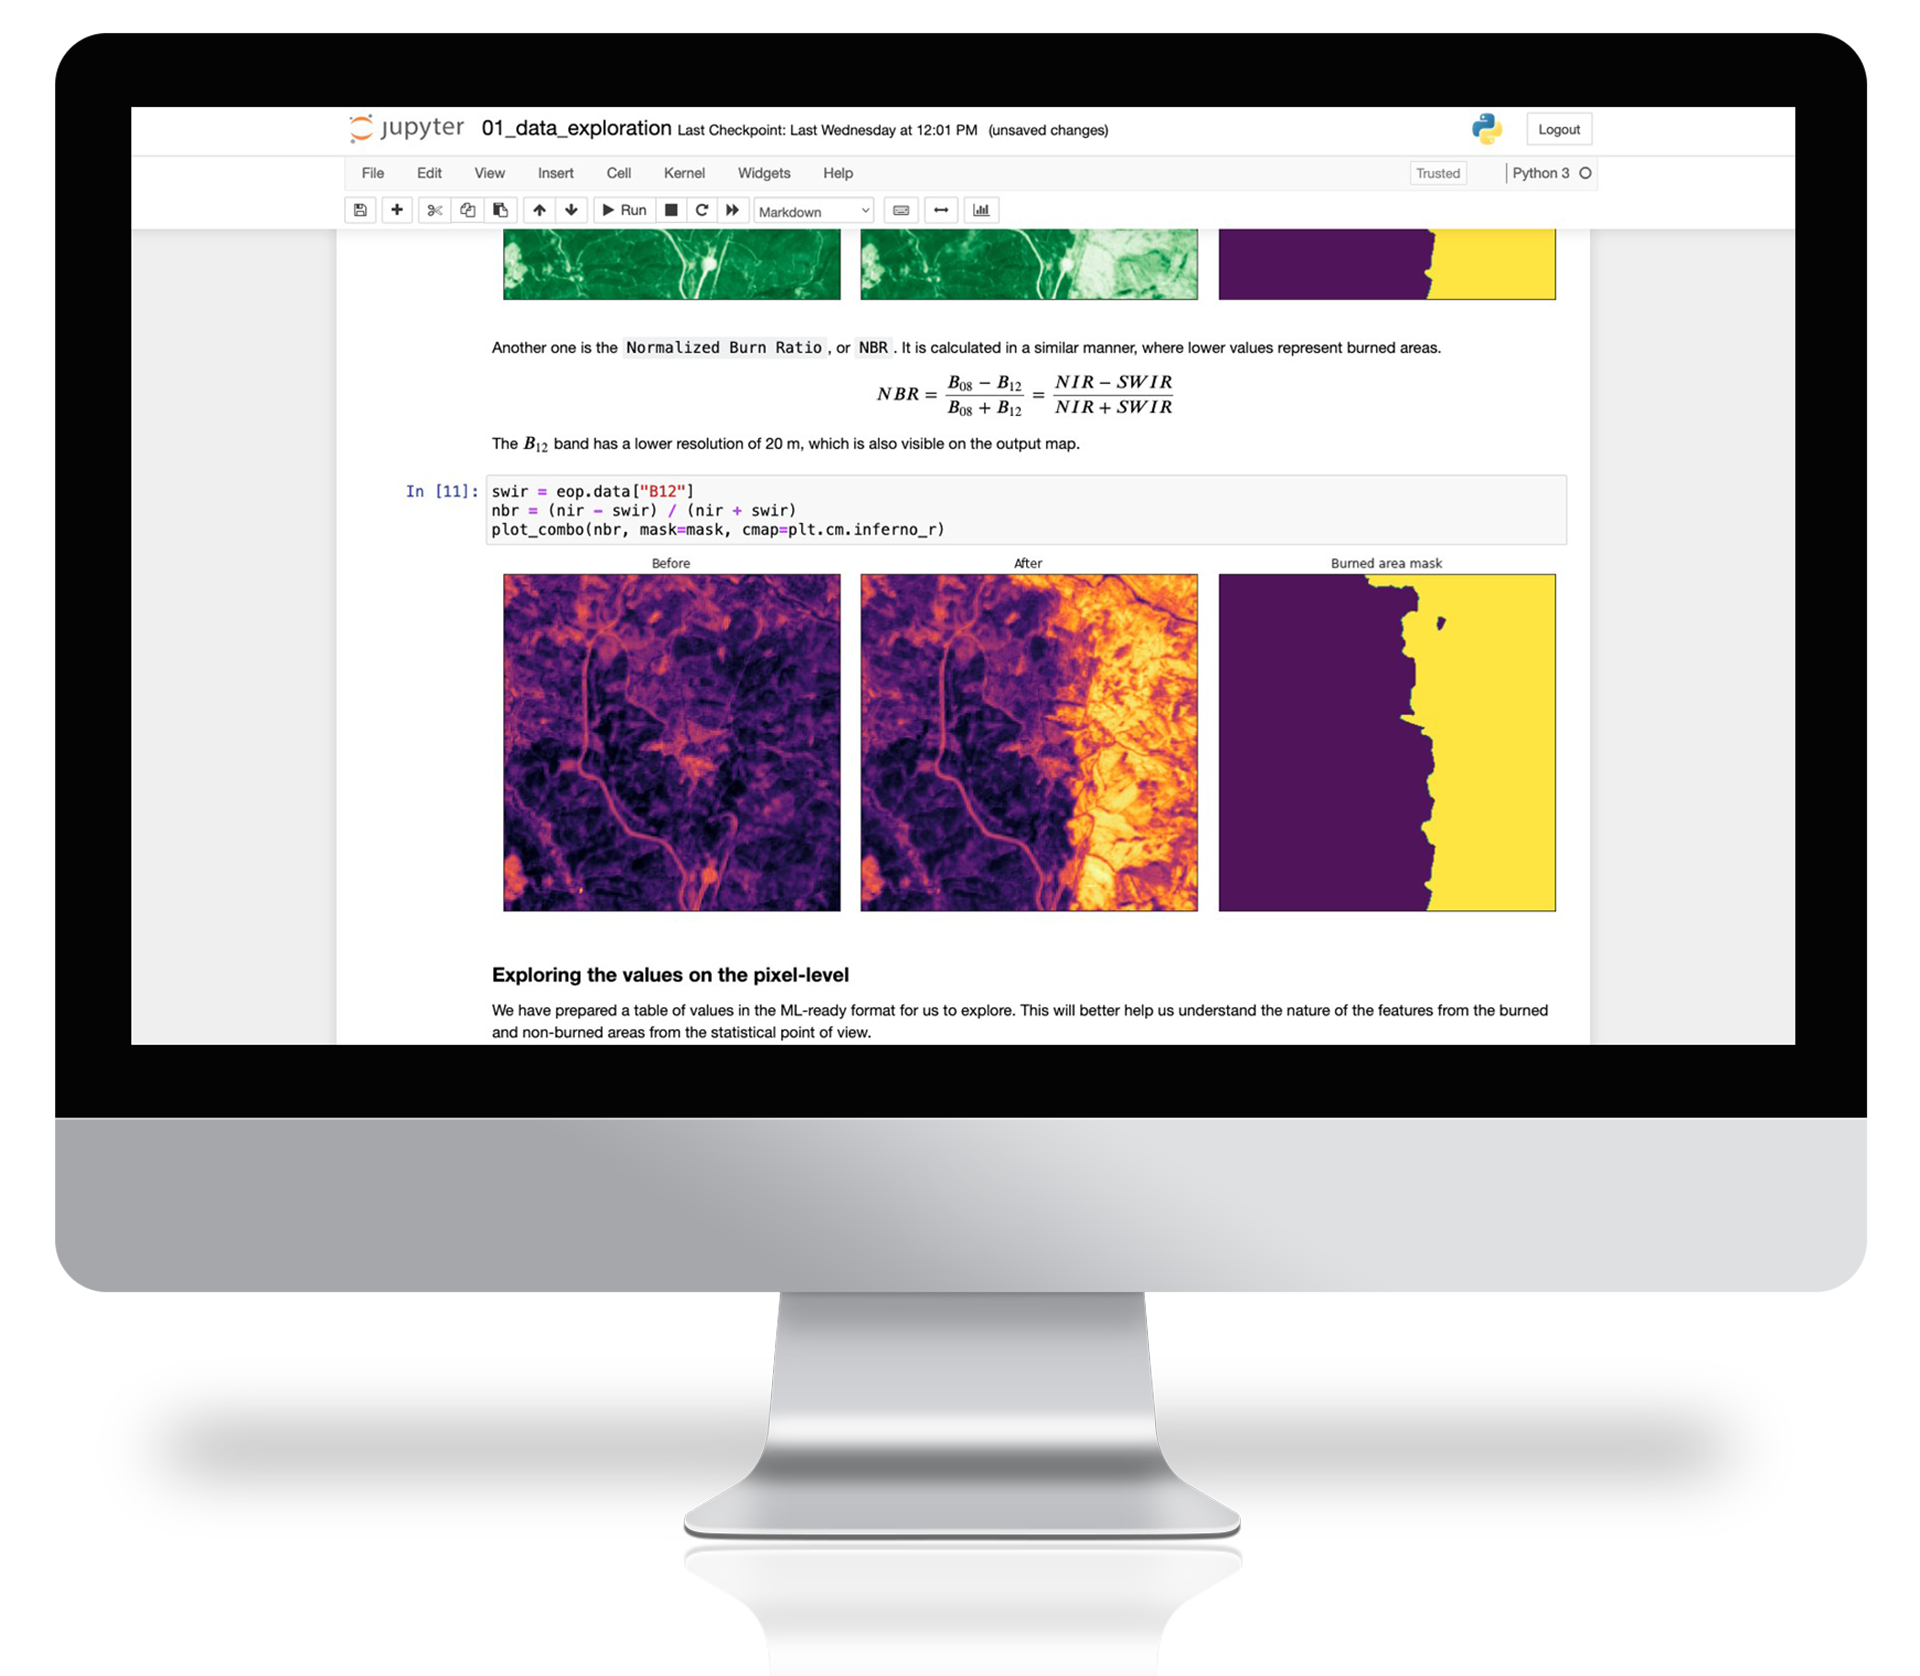 The first part focused on understanding the structure of spatial data, using EOPatches as practical containers and introducing how we store various types of data and how we can access and use them. Then we moved on to understanding the nature of spatial data. We tried to intuitively identify differences between normal and wildfire-affected areas by visually looking at different layers and also taking a more statistical approach by looking at distributions and correlation plots. The research part of the workshop continued with the construction of a homecooked decision tree to identify areas affected by wildfire. Participants looked at the distributions and correlation plots and tried to find a recipe for good performance. The participant with the highest score received eternal glory. 😃
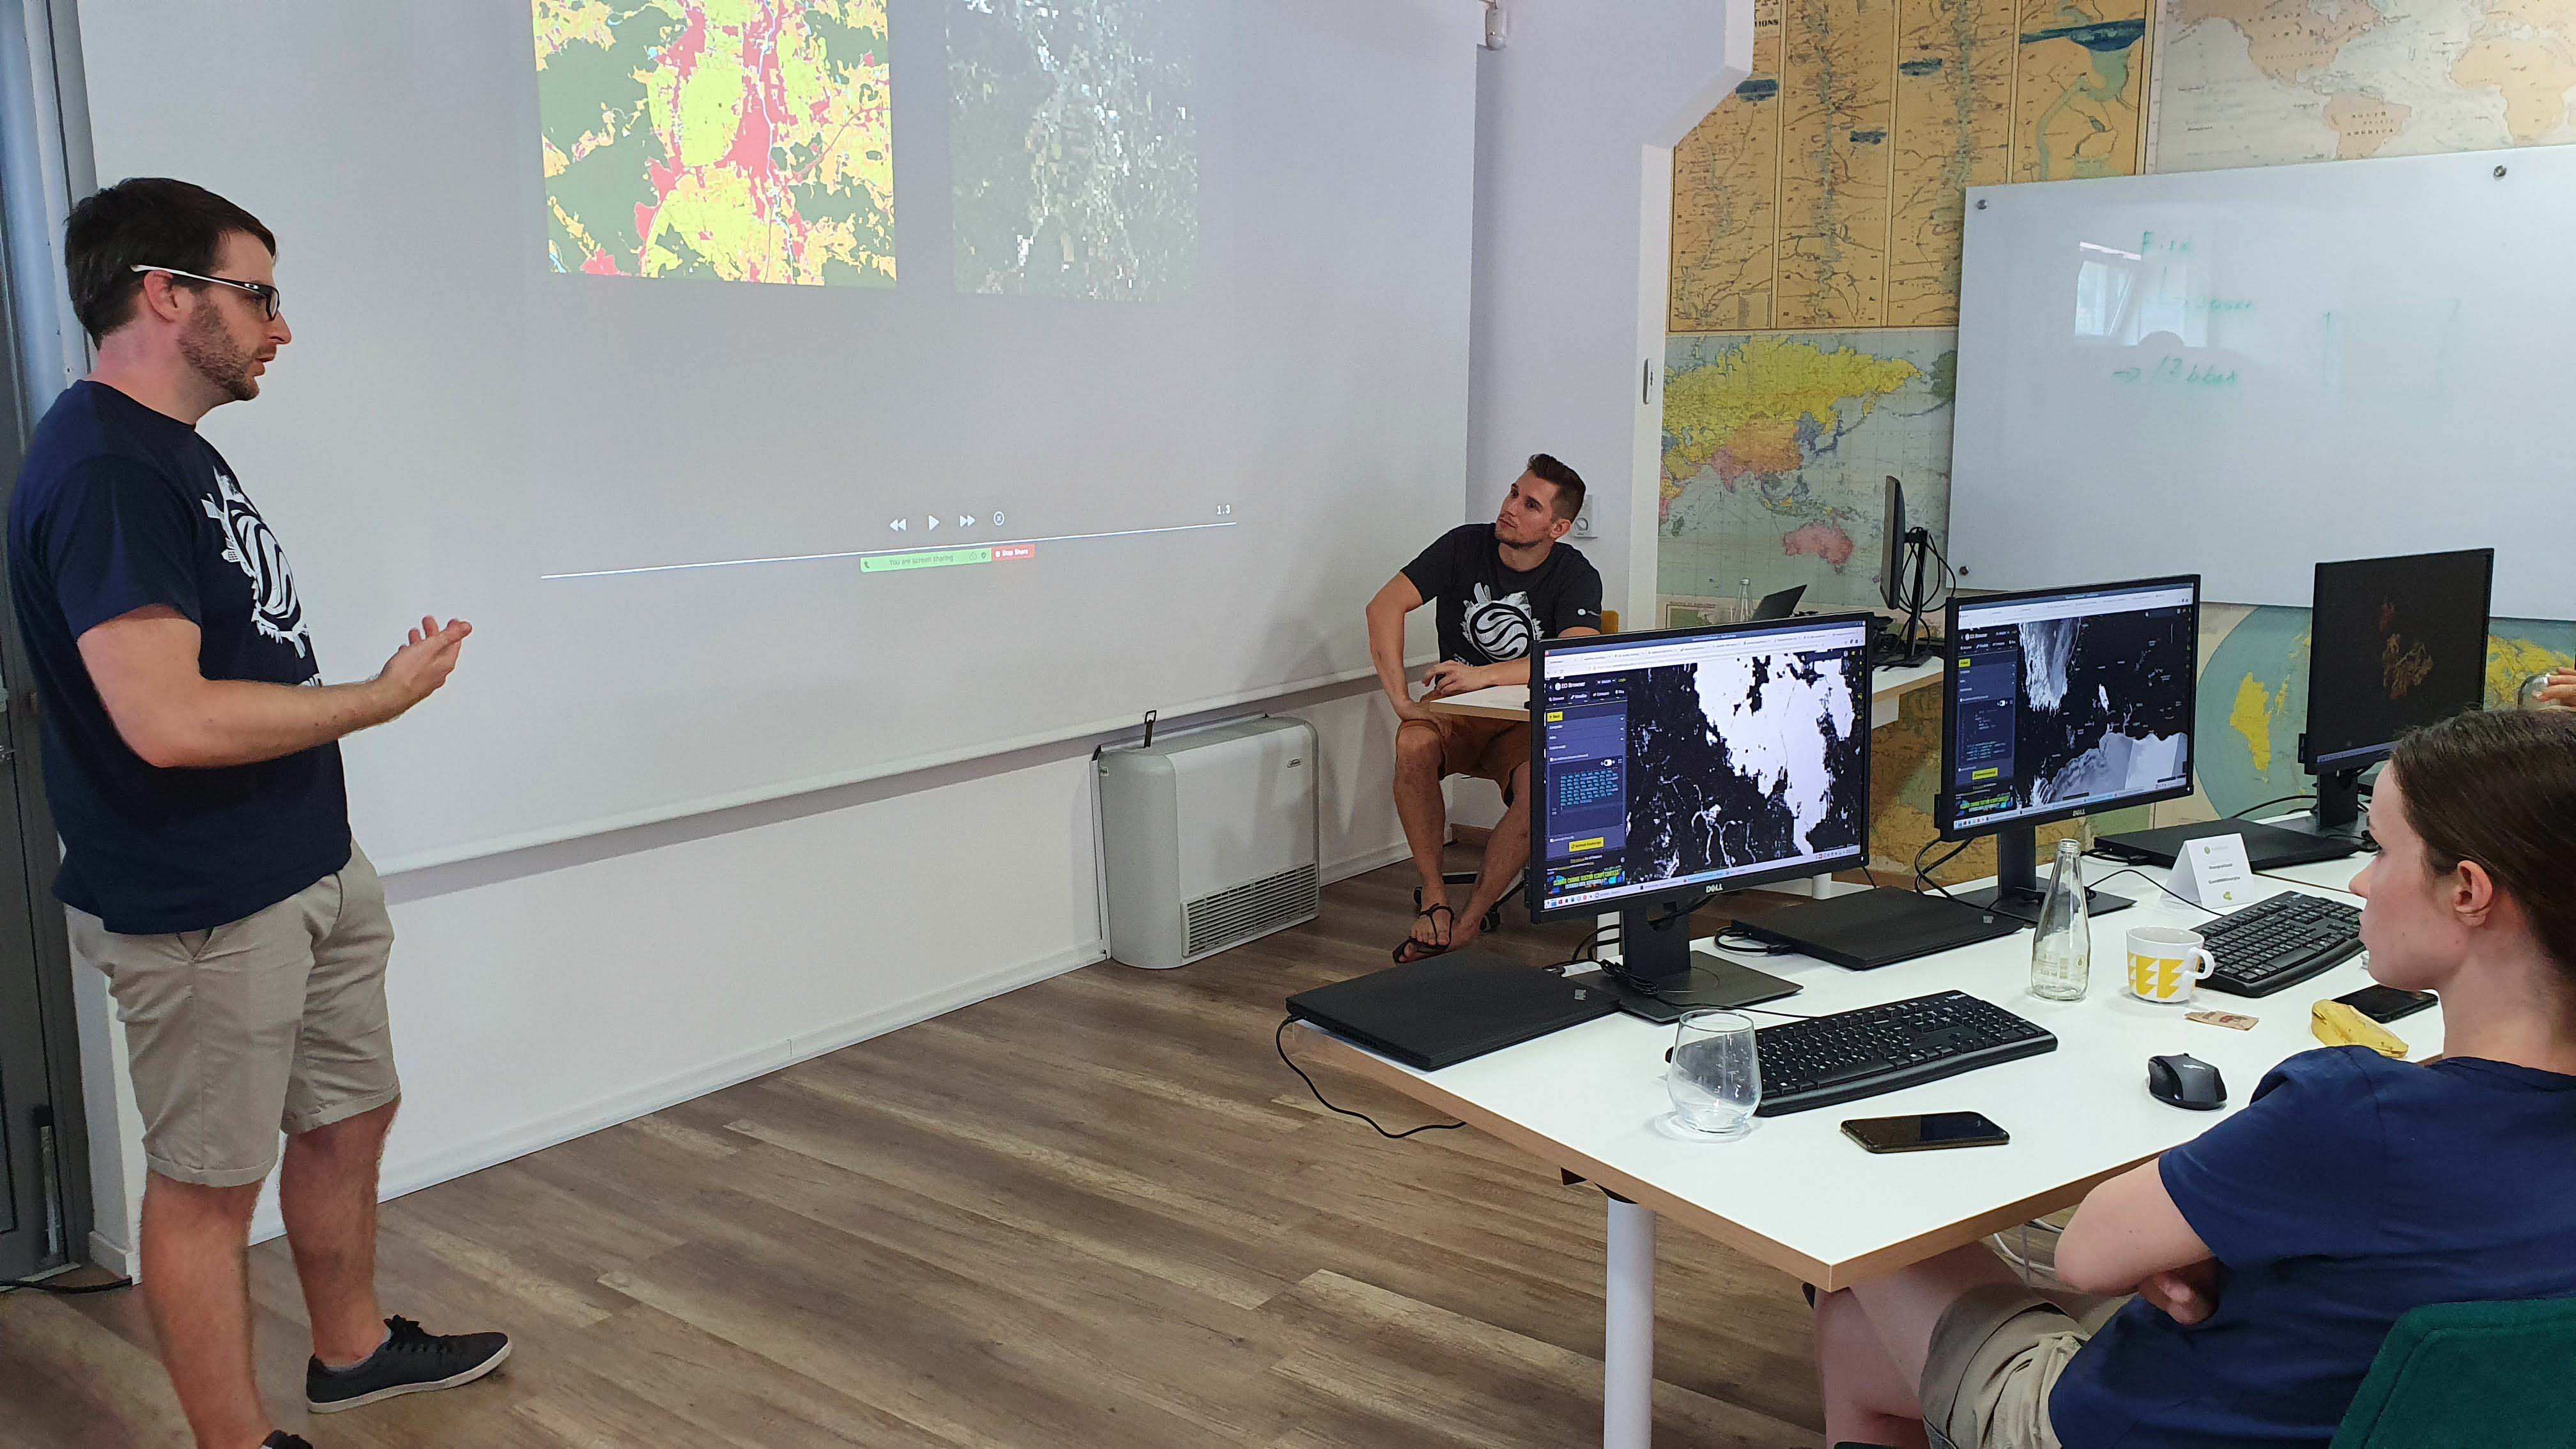
Then we tried two official tools that do the same thing but better - the DecisionTree and the LightGBM classifier. This showed how intuitiveness was gradually lost with the complexity of the model, but performance increased with the limited sample. We tried to point out the pitfalls of overfitting and the importance of visual and quantitative assessment of models. Finally, we evaluated the performance of the model on random areas using EO Browser.
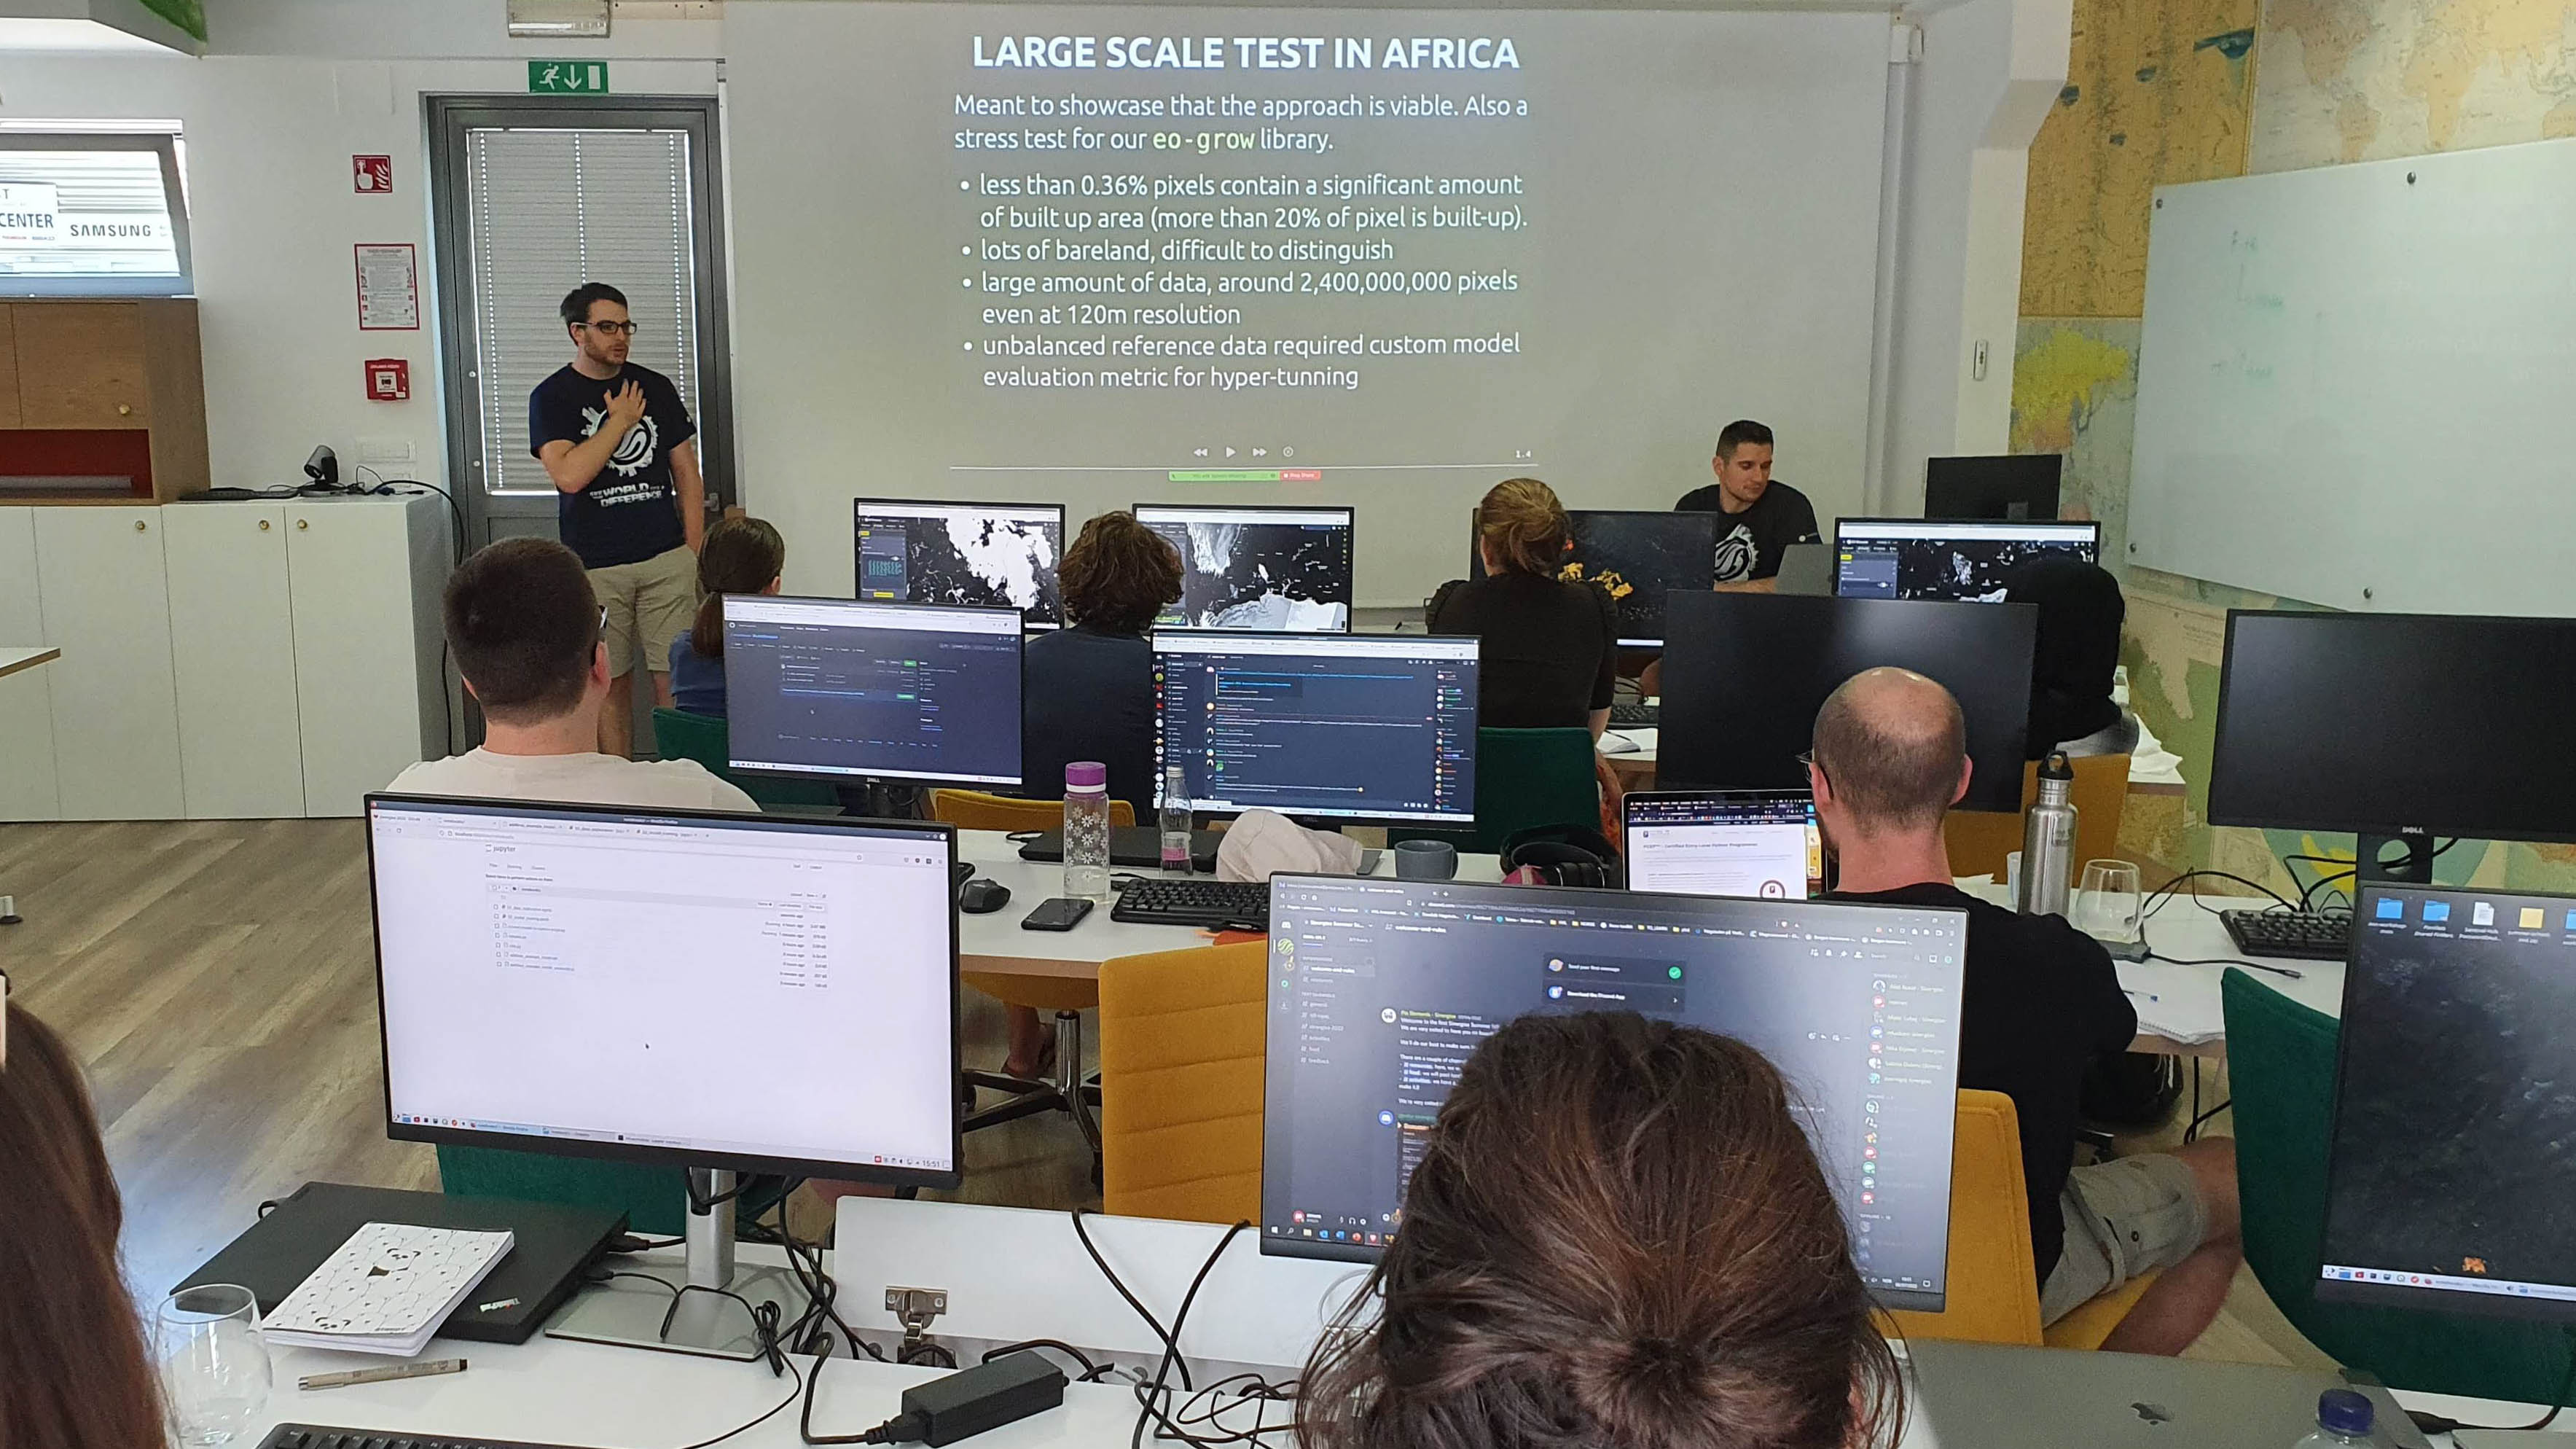
After the workshop, we presented some of the projects we are working on to paint a picture of the real-world problems we are dealing with.
Day 4 - Creating a web application with React
The fourth day was all about presenting the data on a website. We used React to create components to display an interactive map, a search form and details about the wildfires. First, we implemented a search component with the input that queries the data every time the value changes and displays the results as a list of items. Then we implemented a detail component that displays the details of the selected wildfire.
After that, we implemented a map component using the leaflet.js library and displayed the geometries of the wildfires on the map. To display the search results and geometries on the map, we retrieved the data from the REST API we had developed on the second day. We implemented two event handlers for clicking the results and geometries on the map, so that when one of them was clicked, the details for the clicked wildfire were displayed in the detail component.
Finally, we added a WMS layer to the map that requested the data from Sentinel Hub and experimented with different parameters such as time and evalscript to create different visualisations.
Day 5 - A brief review of the week
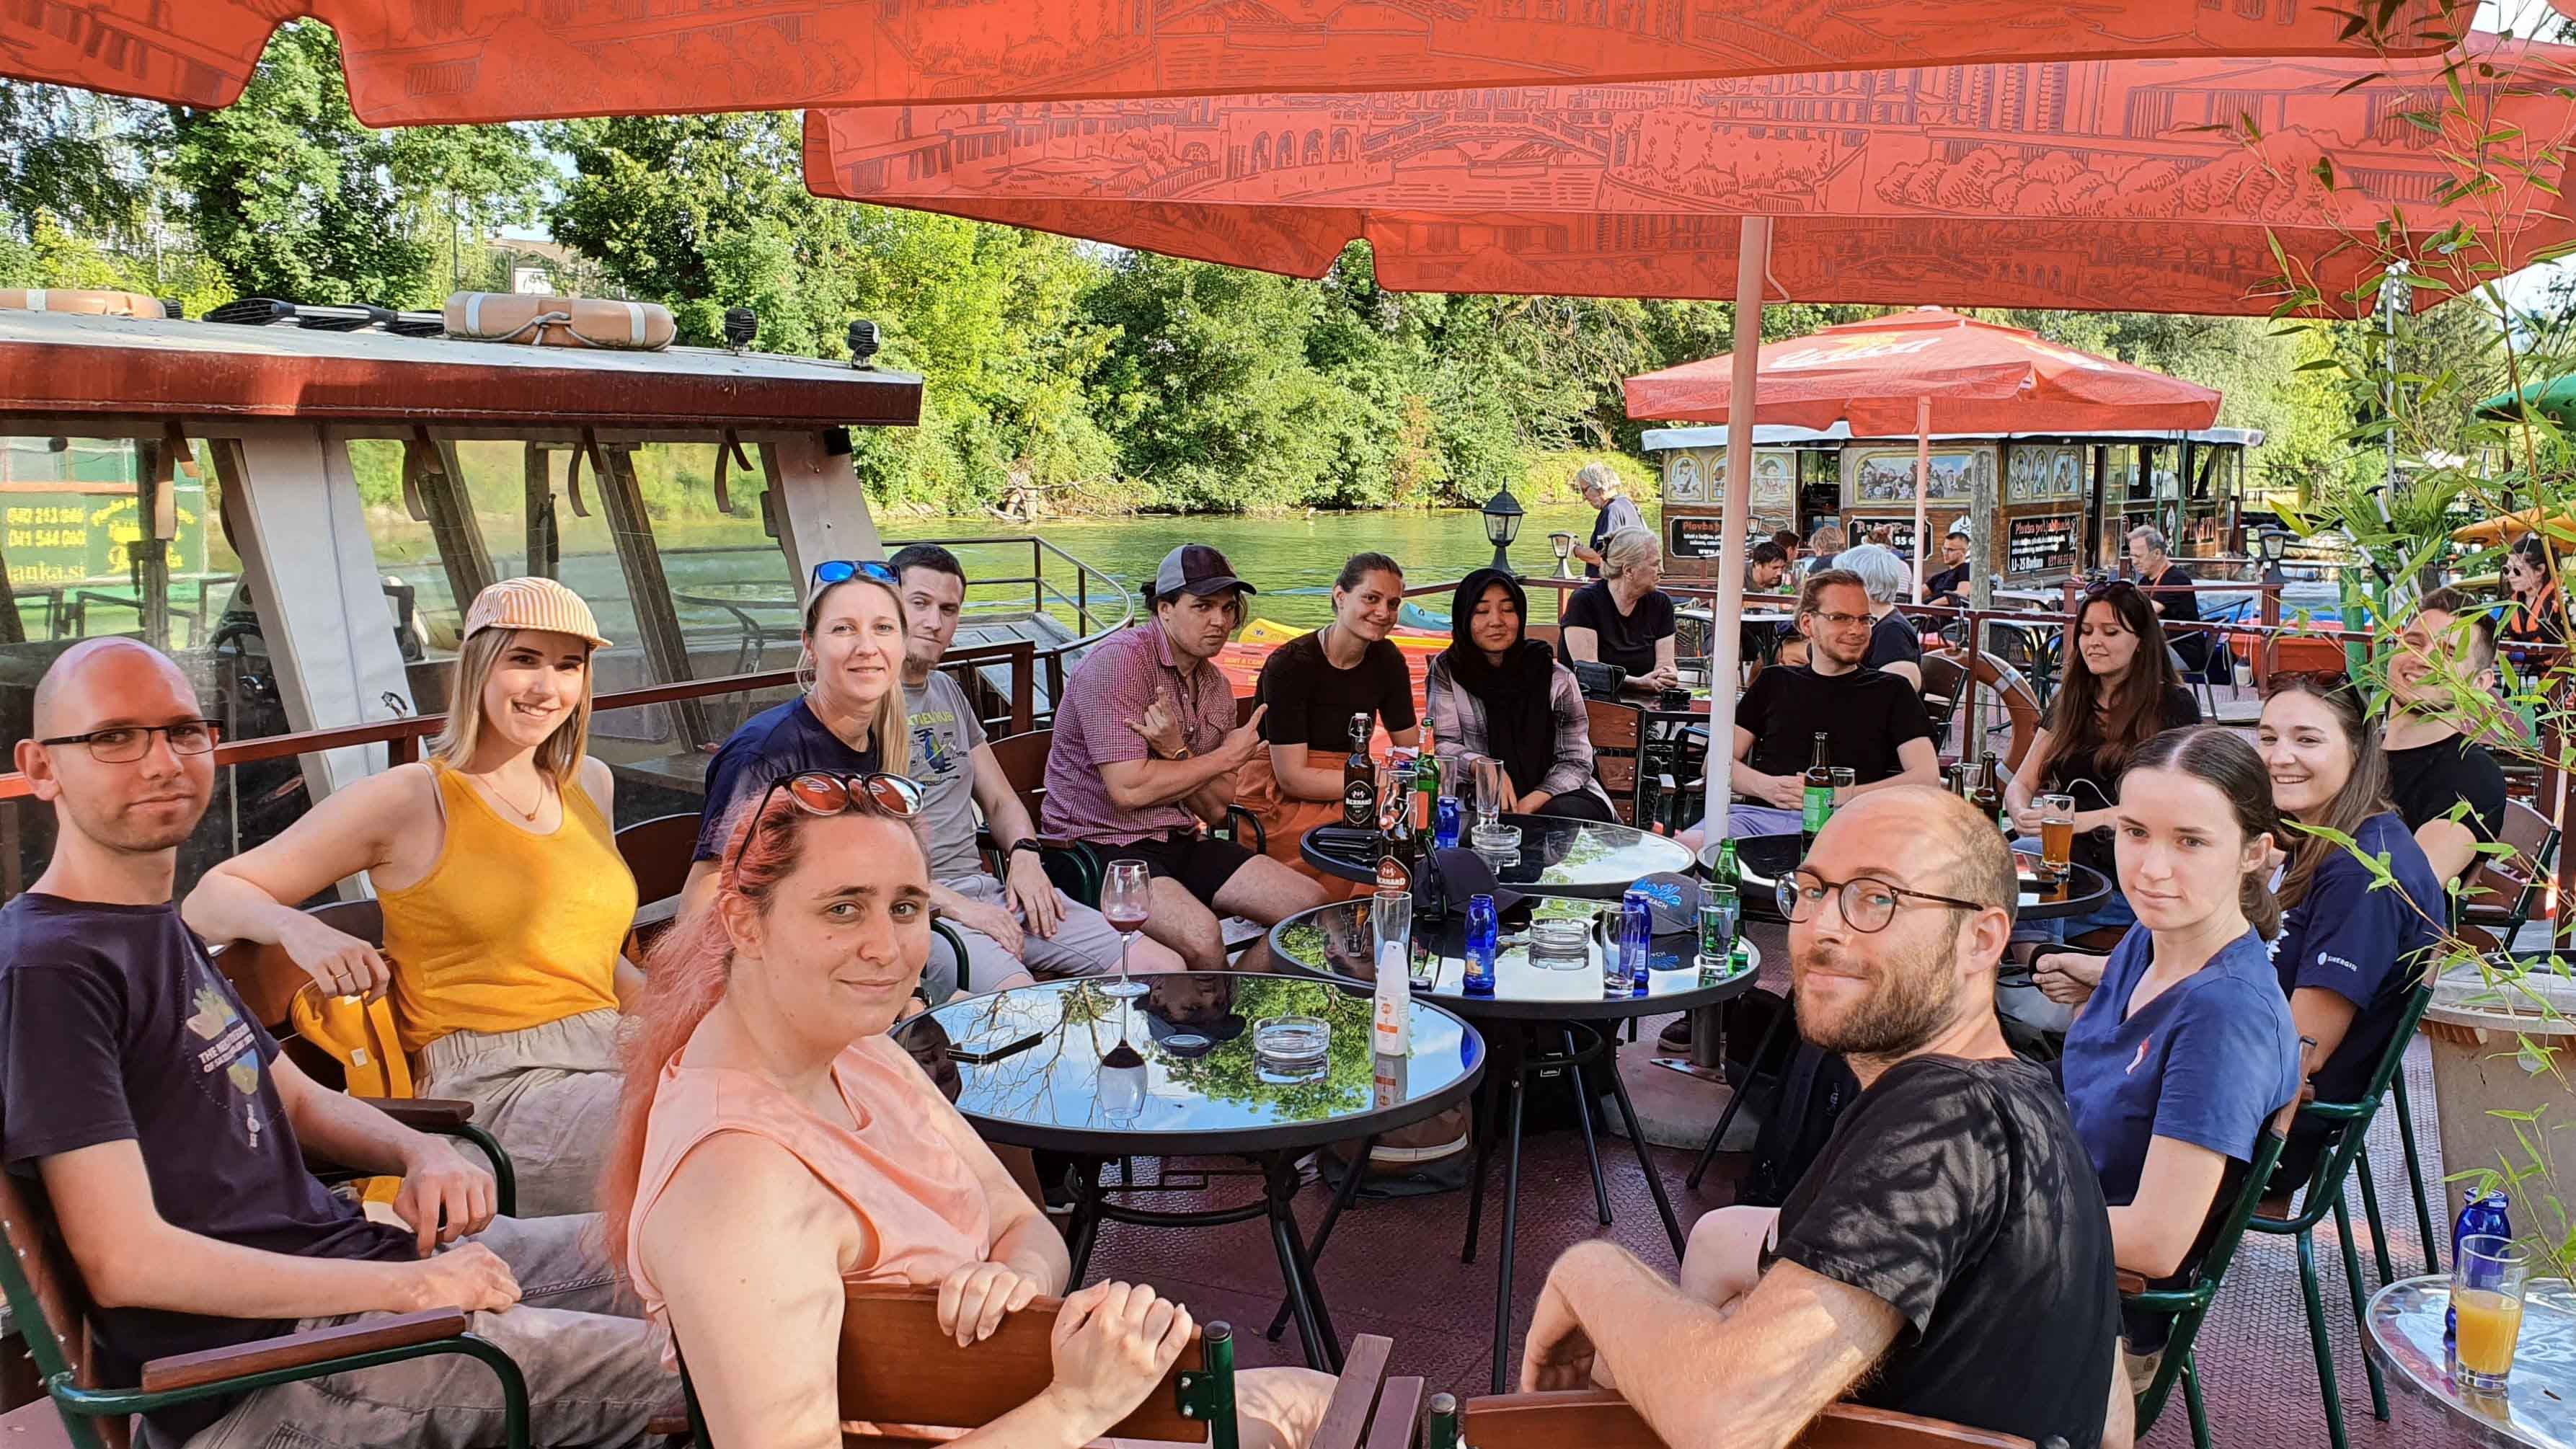
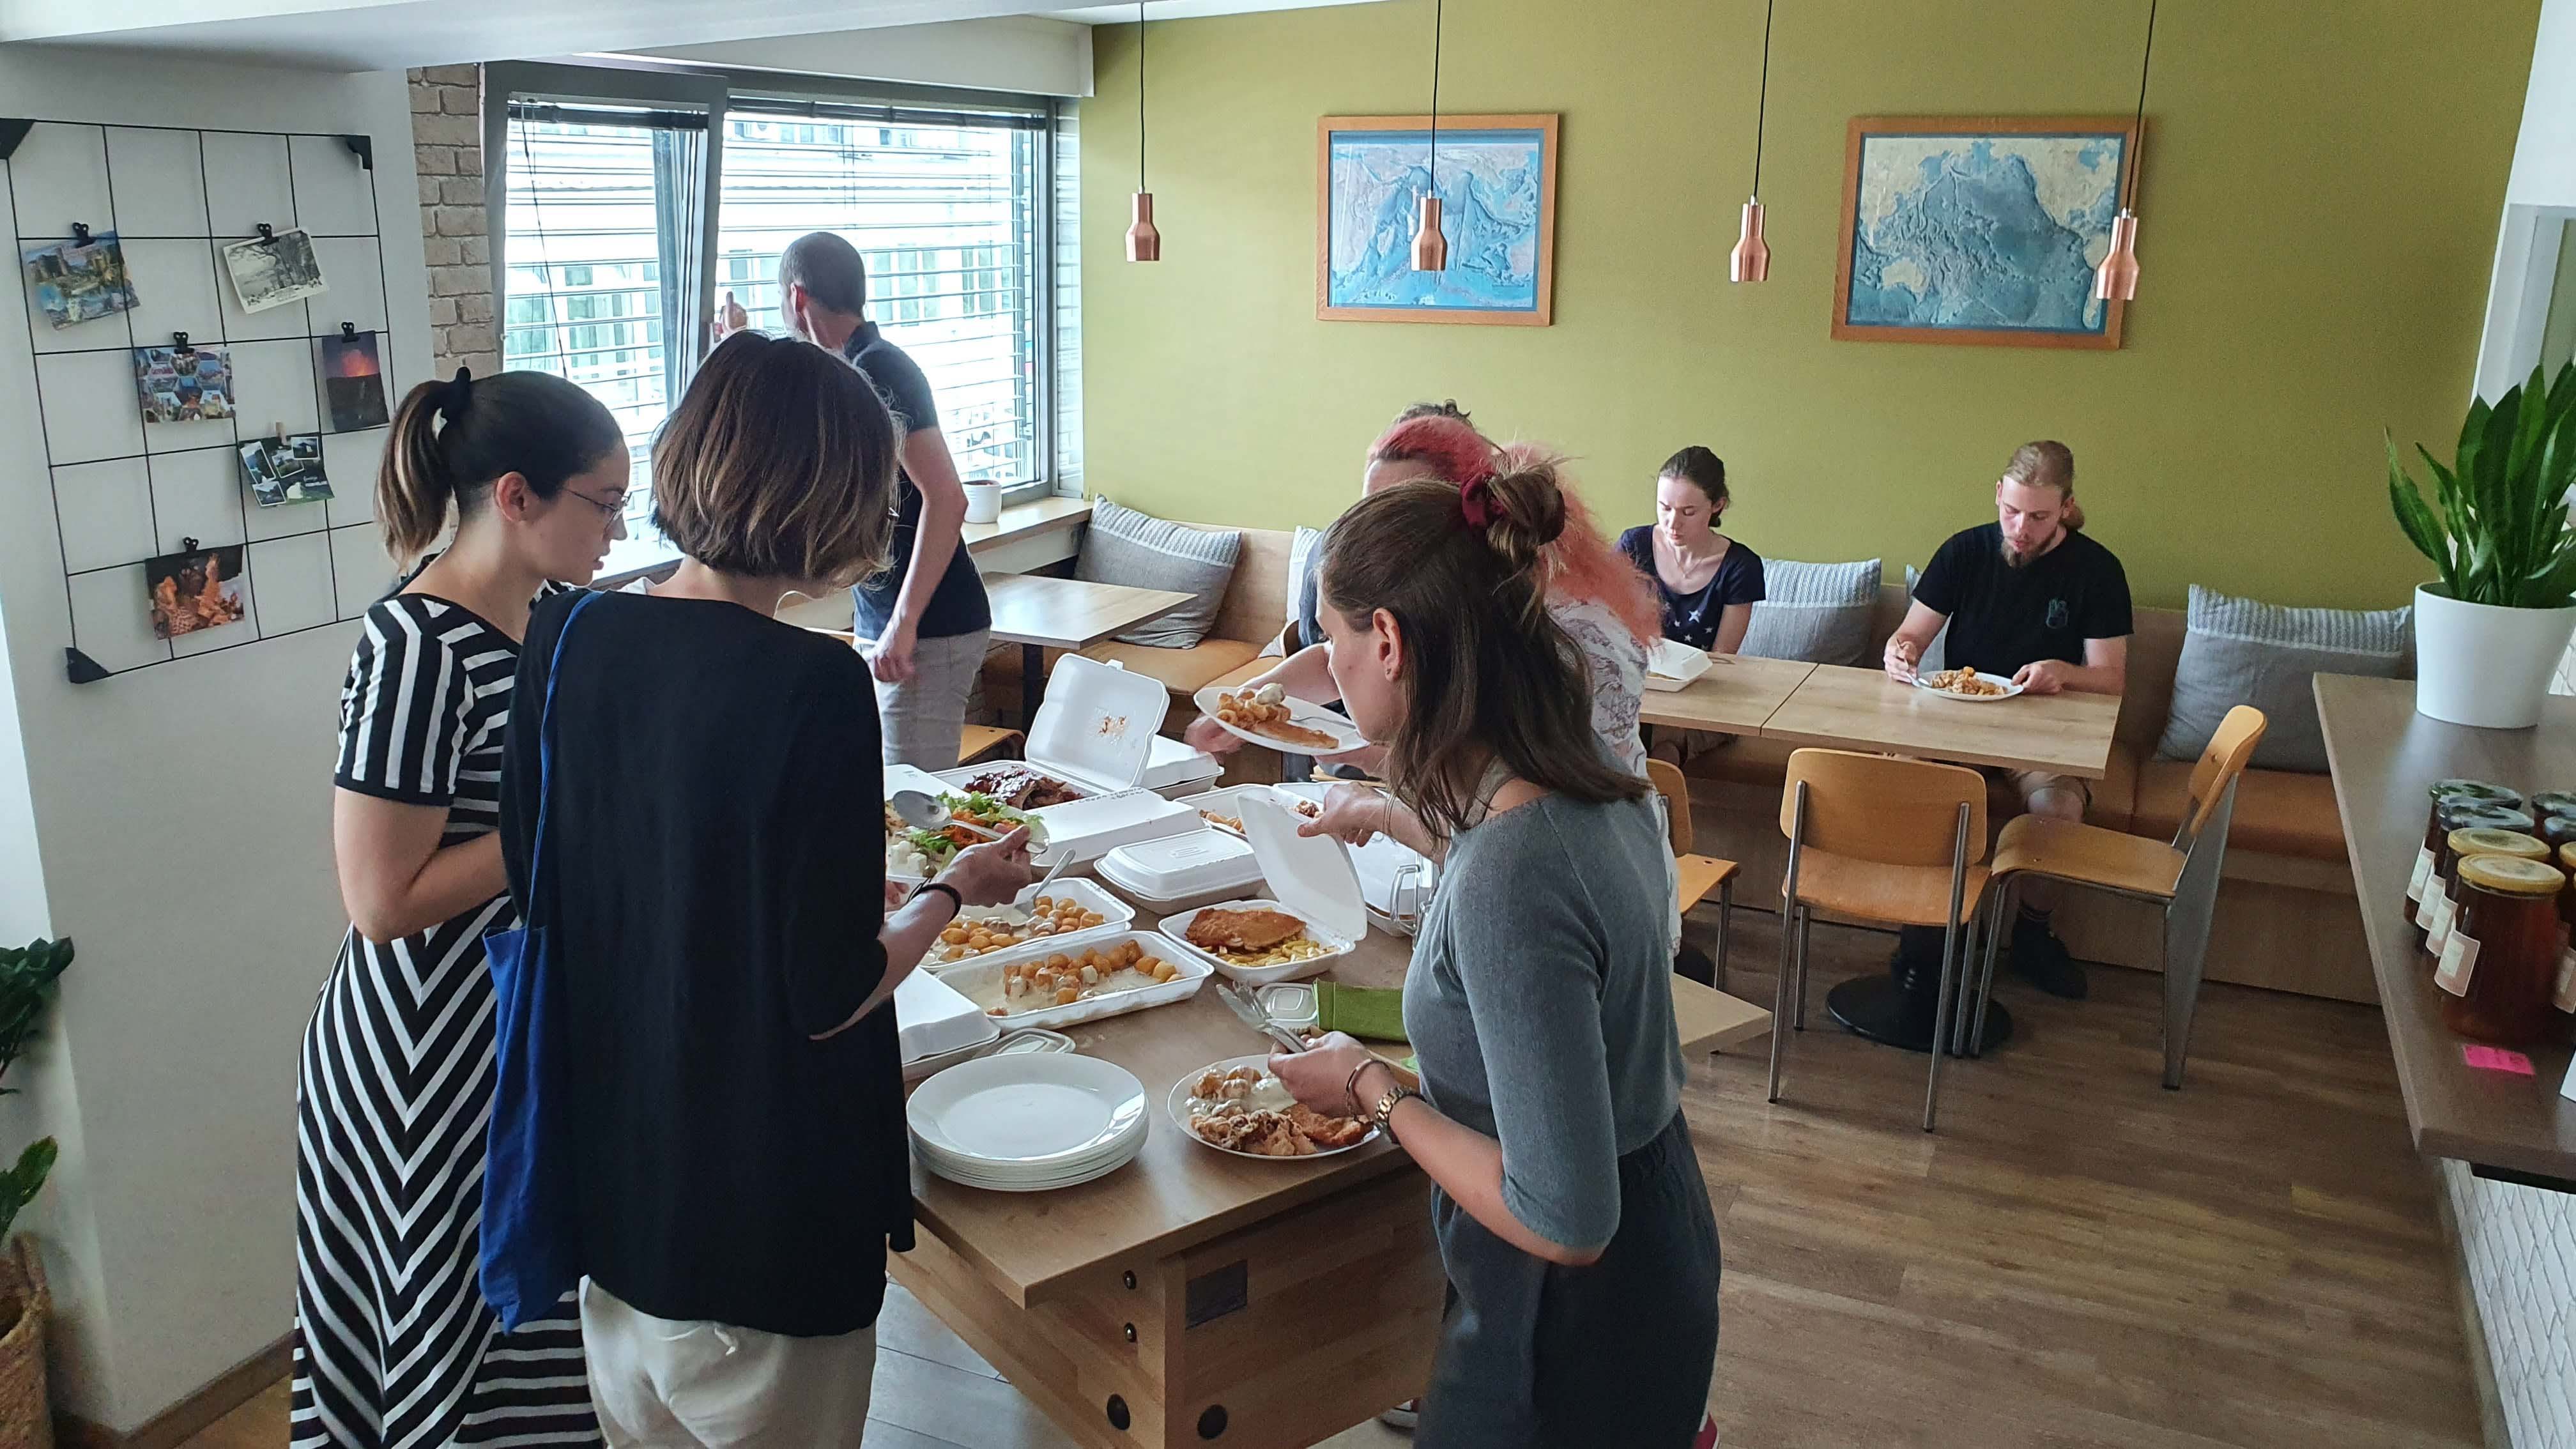
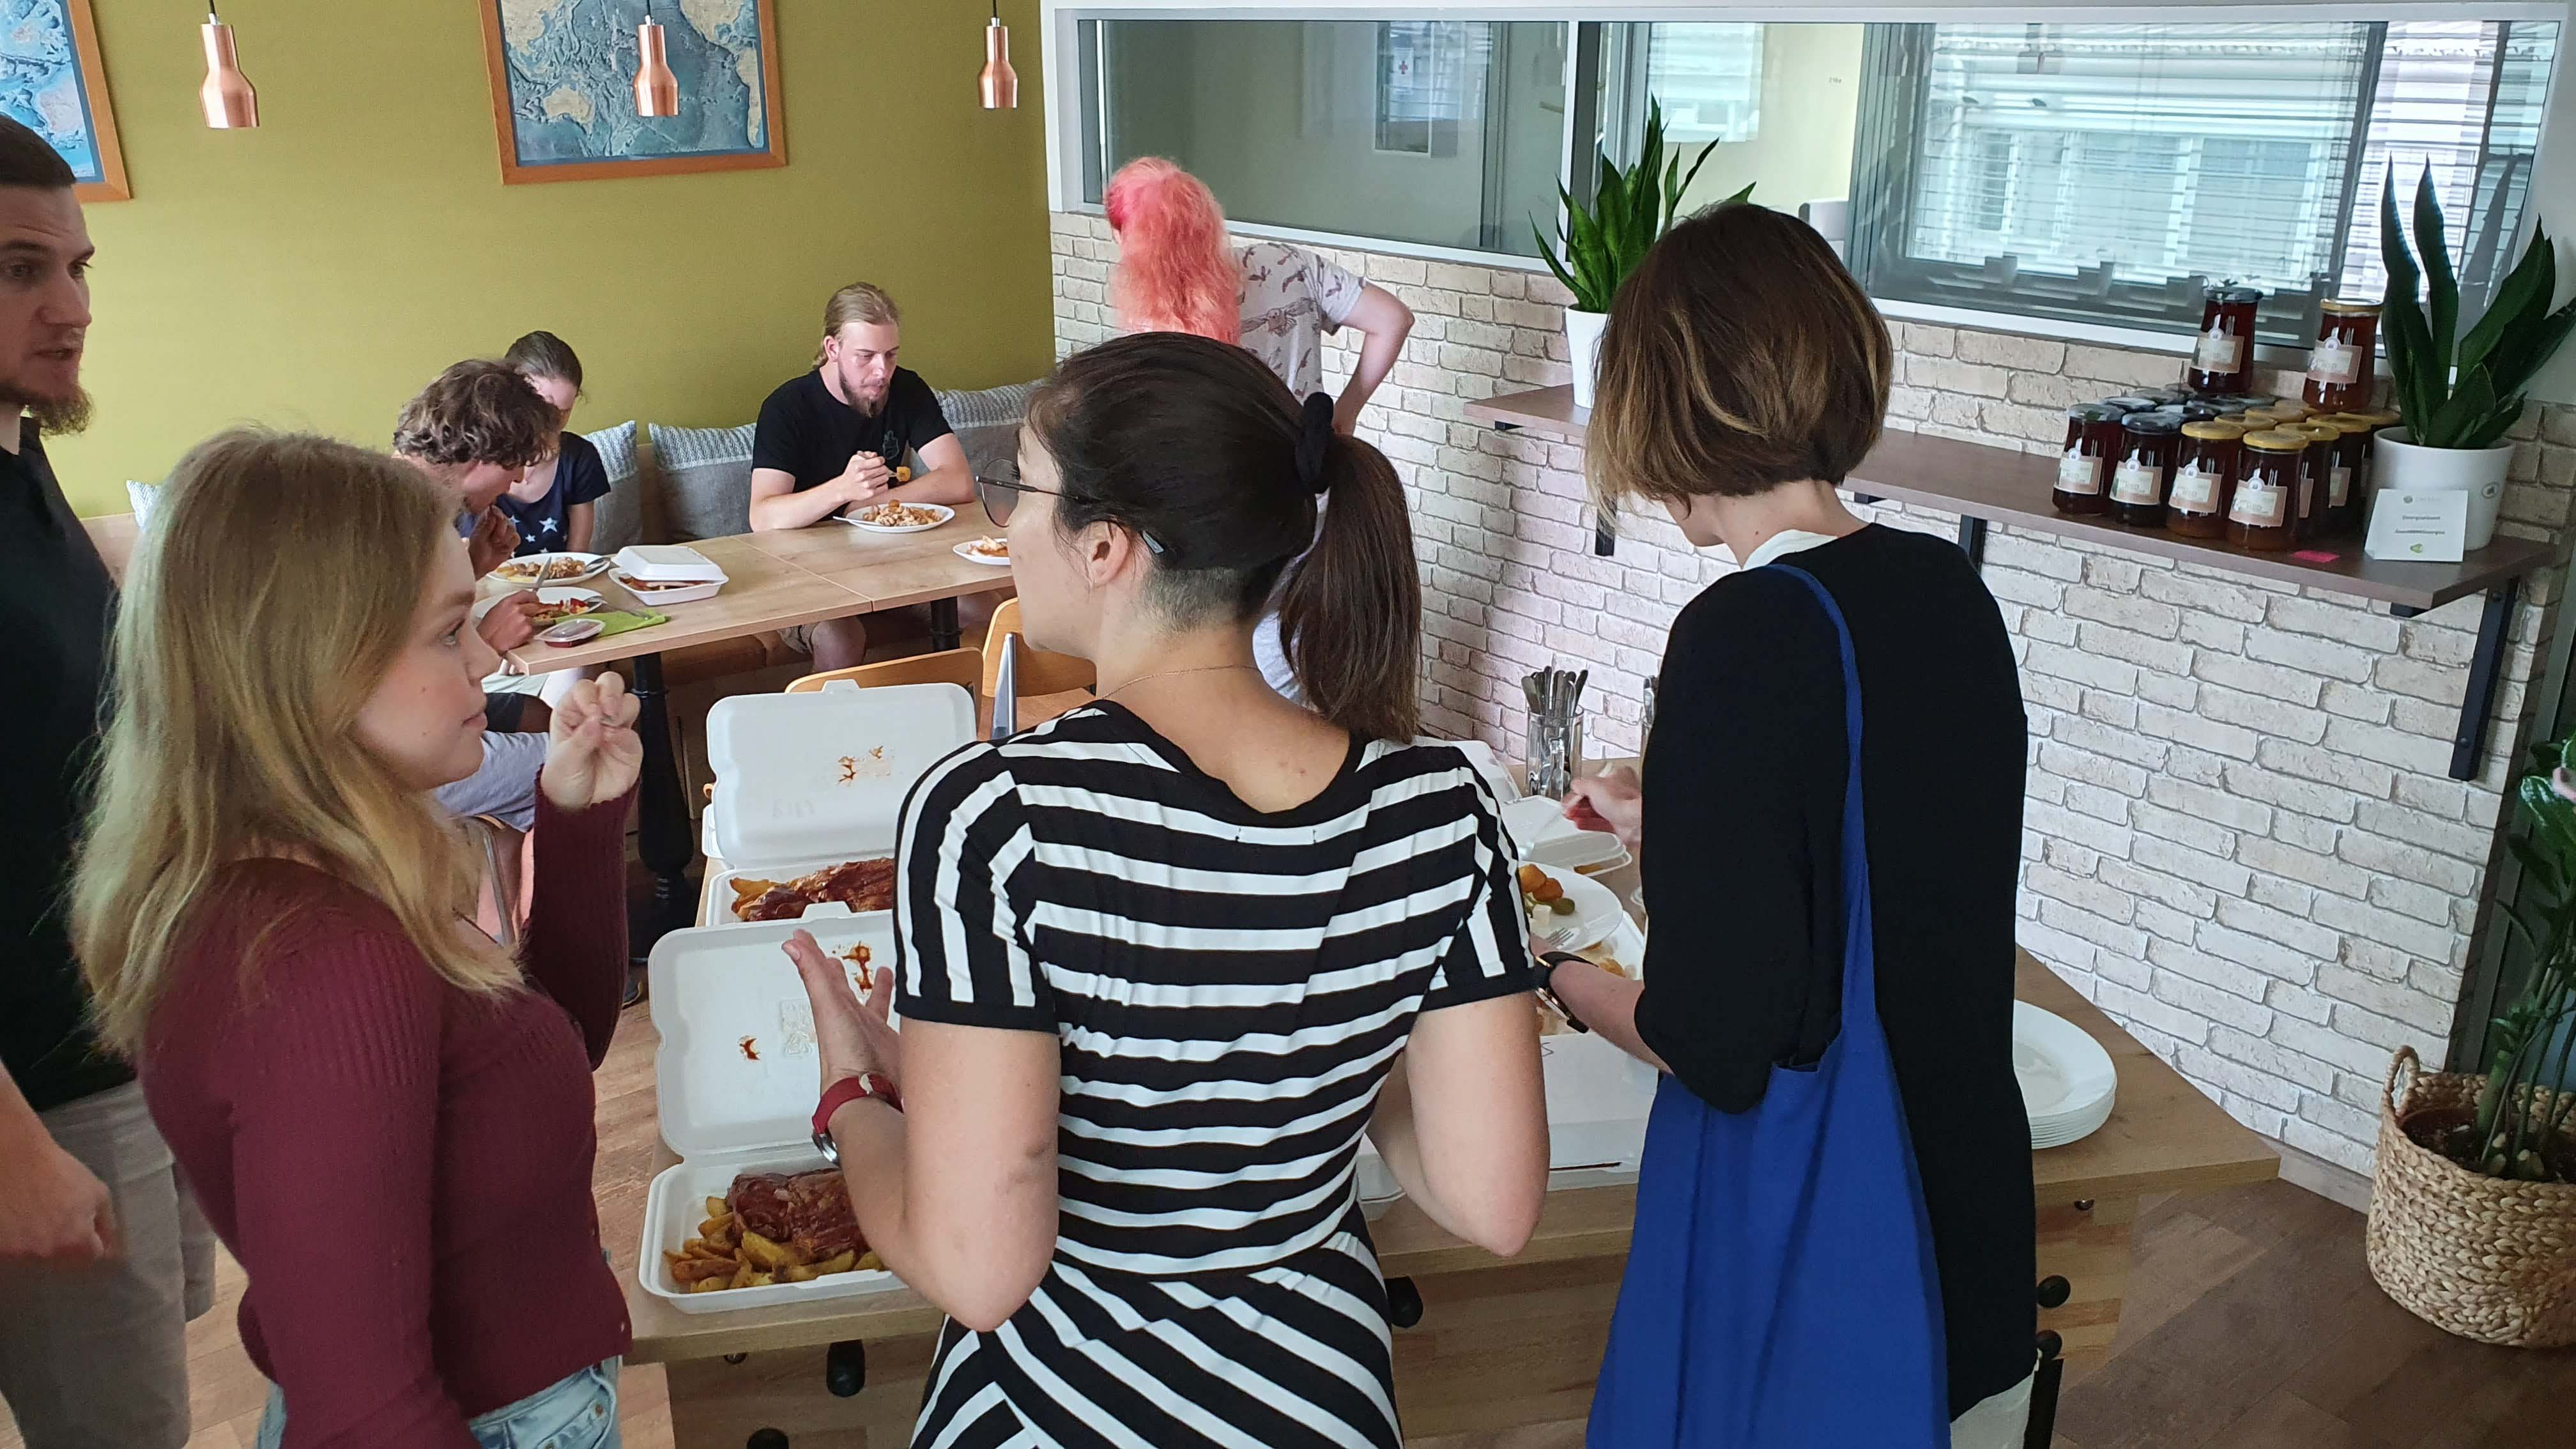
On the last day, it was time to regain the overview of the topics we had learnt. In just one week, we showed how to process satellite imagery and save it in an AWS S3 bucket, serve data via REST API, display it in a web application and apply machine learning algorithms to it. Participants worked with technologies such as Java / Spring boot, React and Python. We walked them through each of these steps, focusing on a wildfires use-case. After a lively conversation with the participants, we went out for burgers together and ended the week.
Looking forward to the next one
Giving a behind the scenes look at what we do, how we do it and how we are doing our part to create a better future for our planet was a unique demonstration that we have never done before. It was an exciting week where we had the opportunity to meet interesting and curious young people. We believe that with their new knowledge and enthusiasm, they will dive further into Earth Observation and look for ways to use these powerful data and services to help preserve our planet. We are already looking forward to our next Summer School.
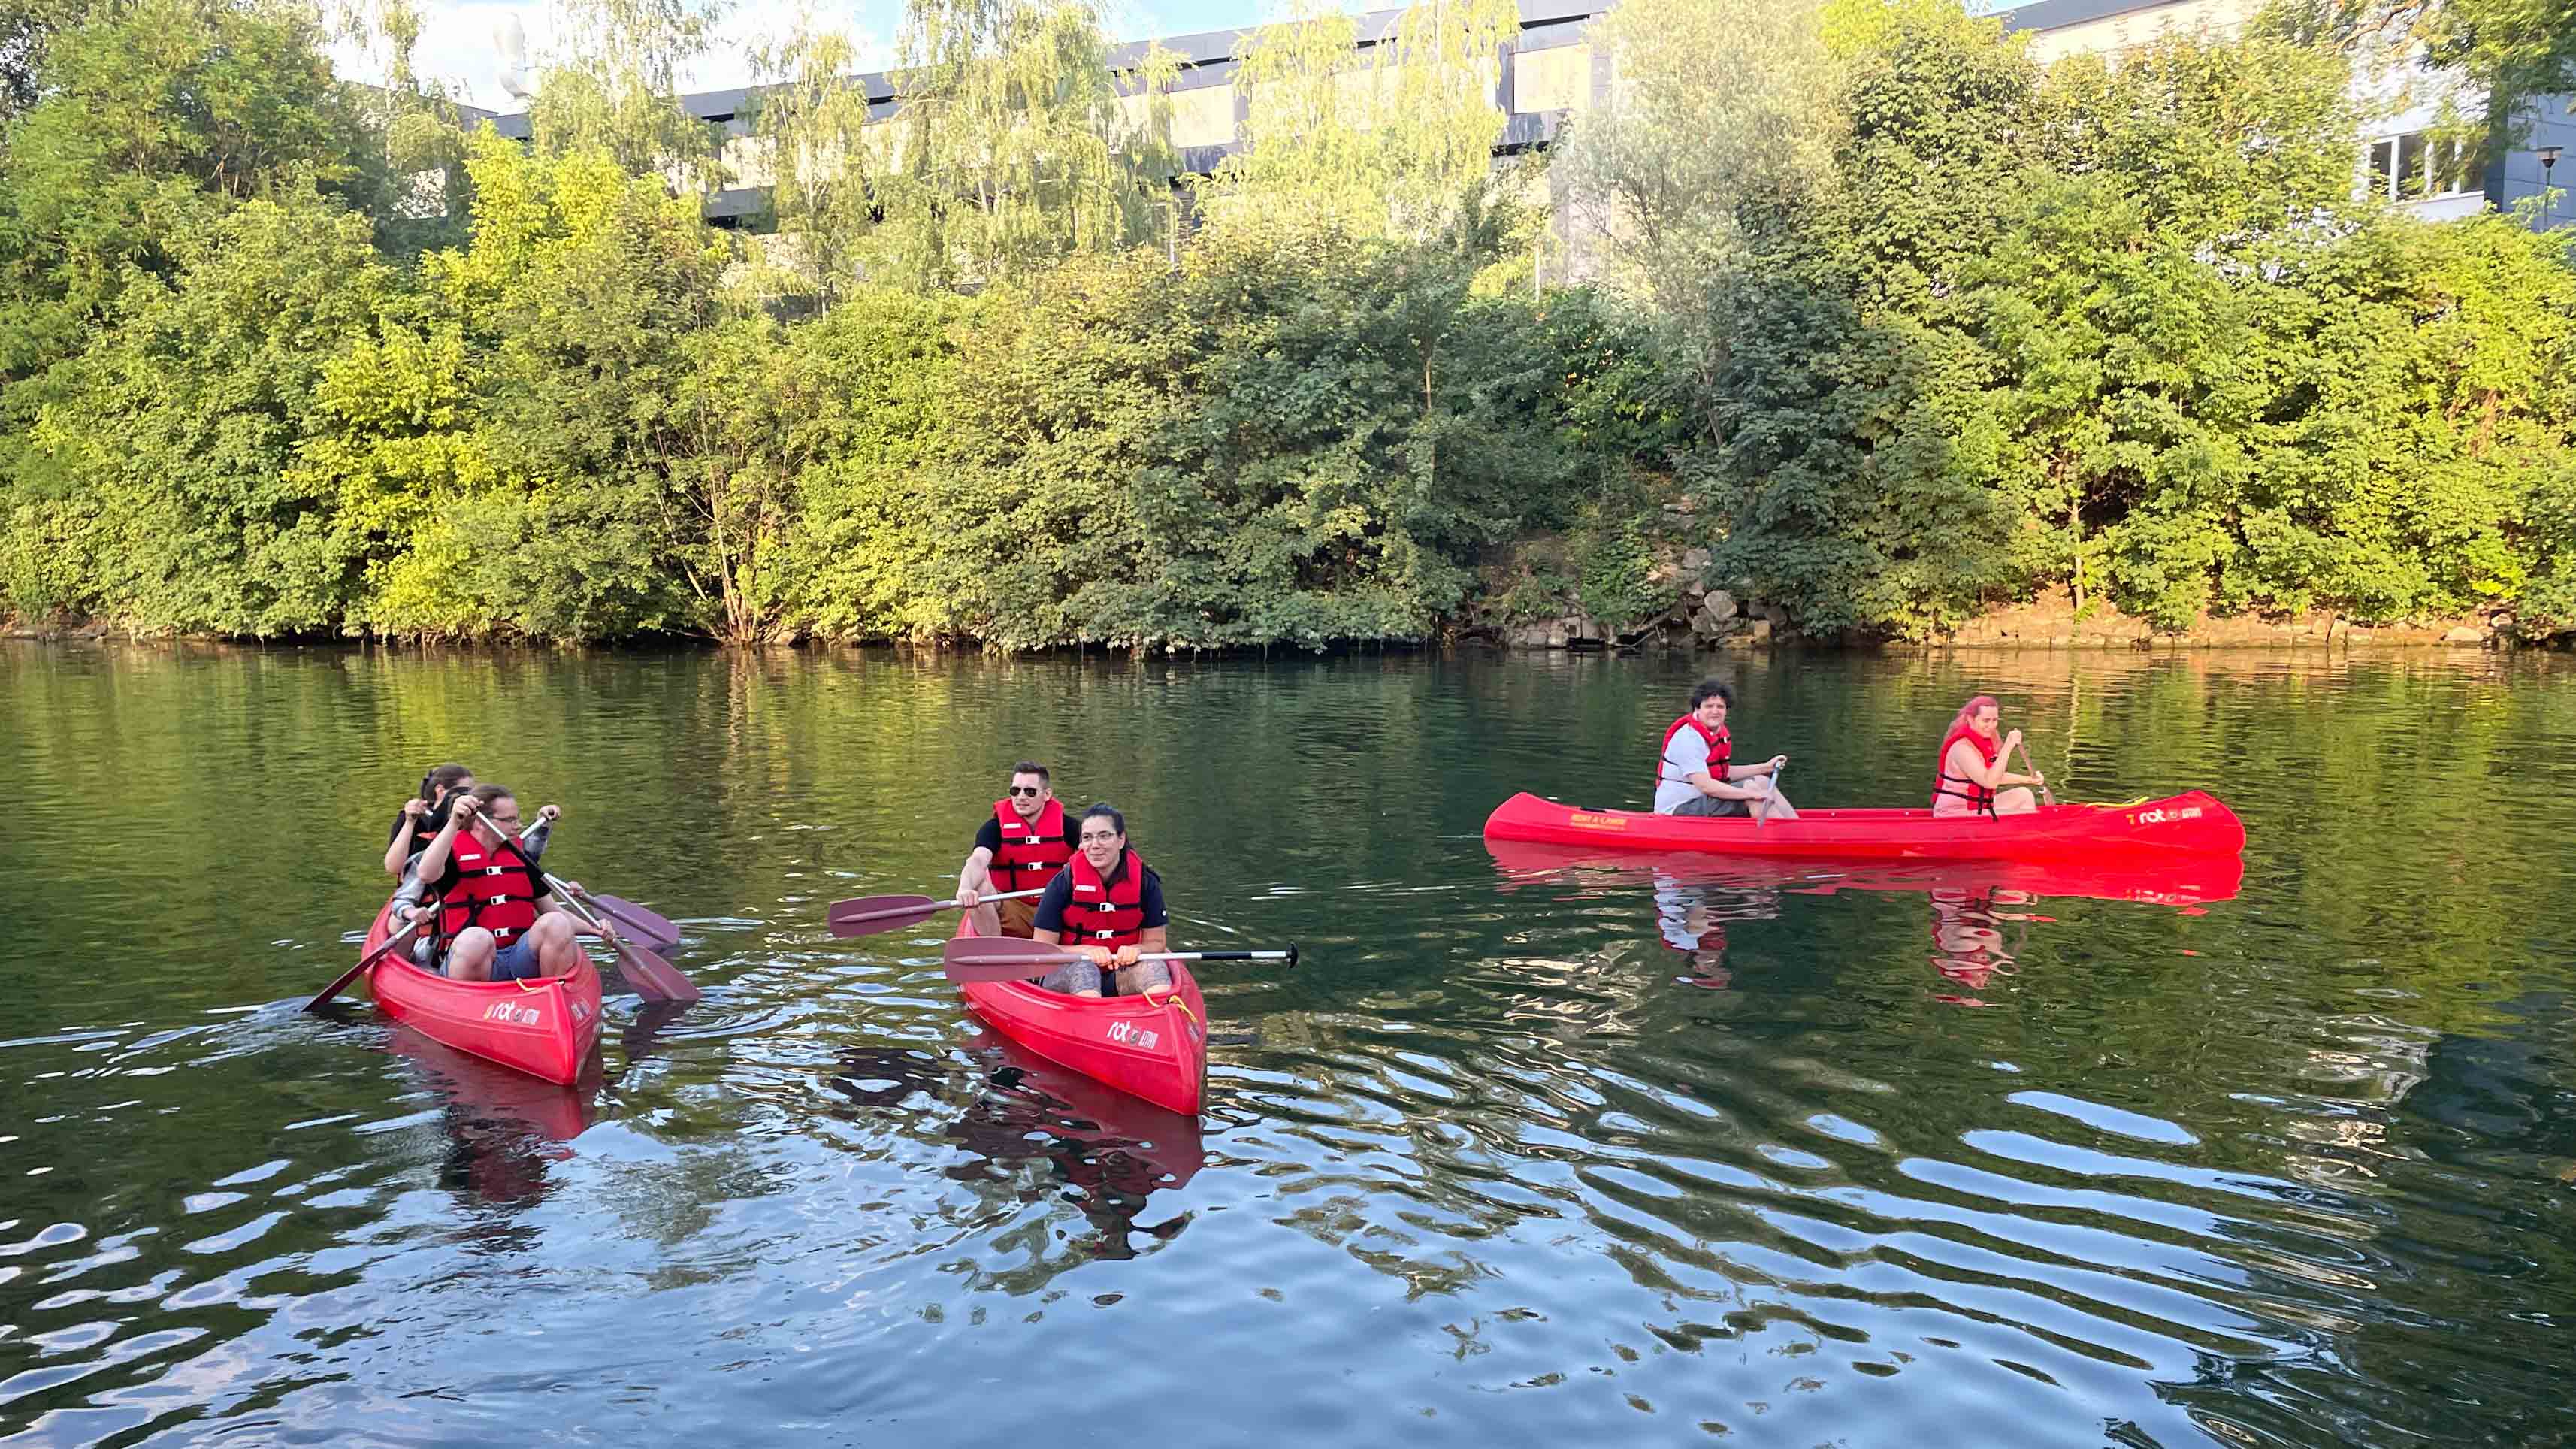
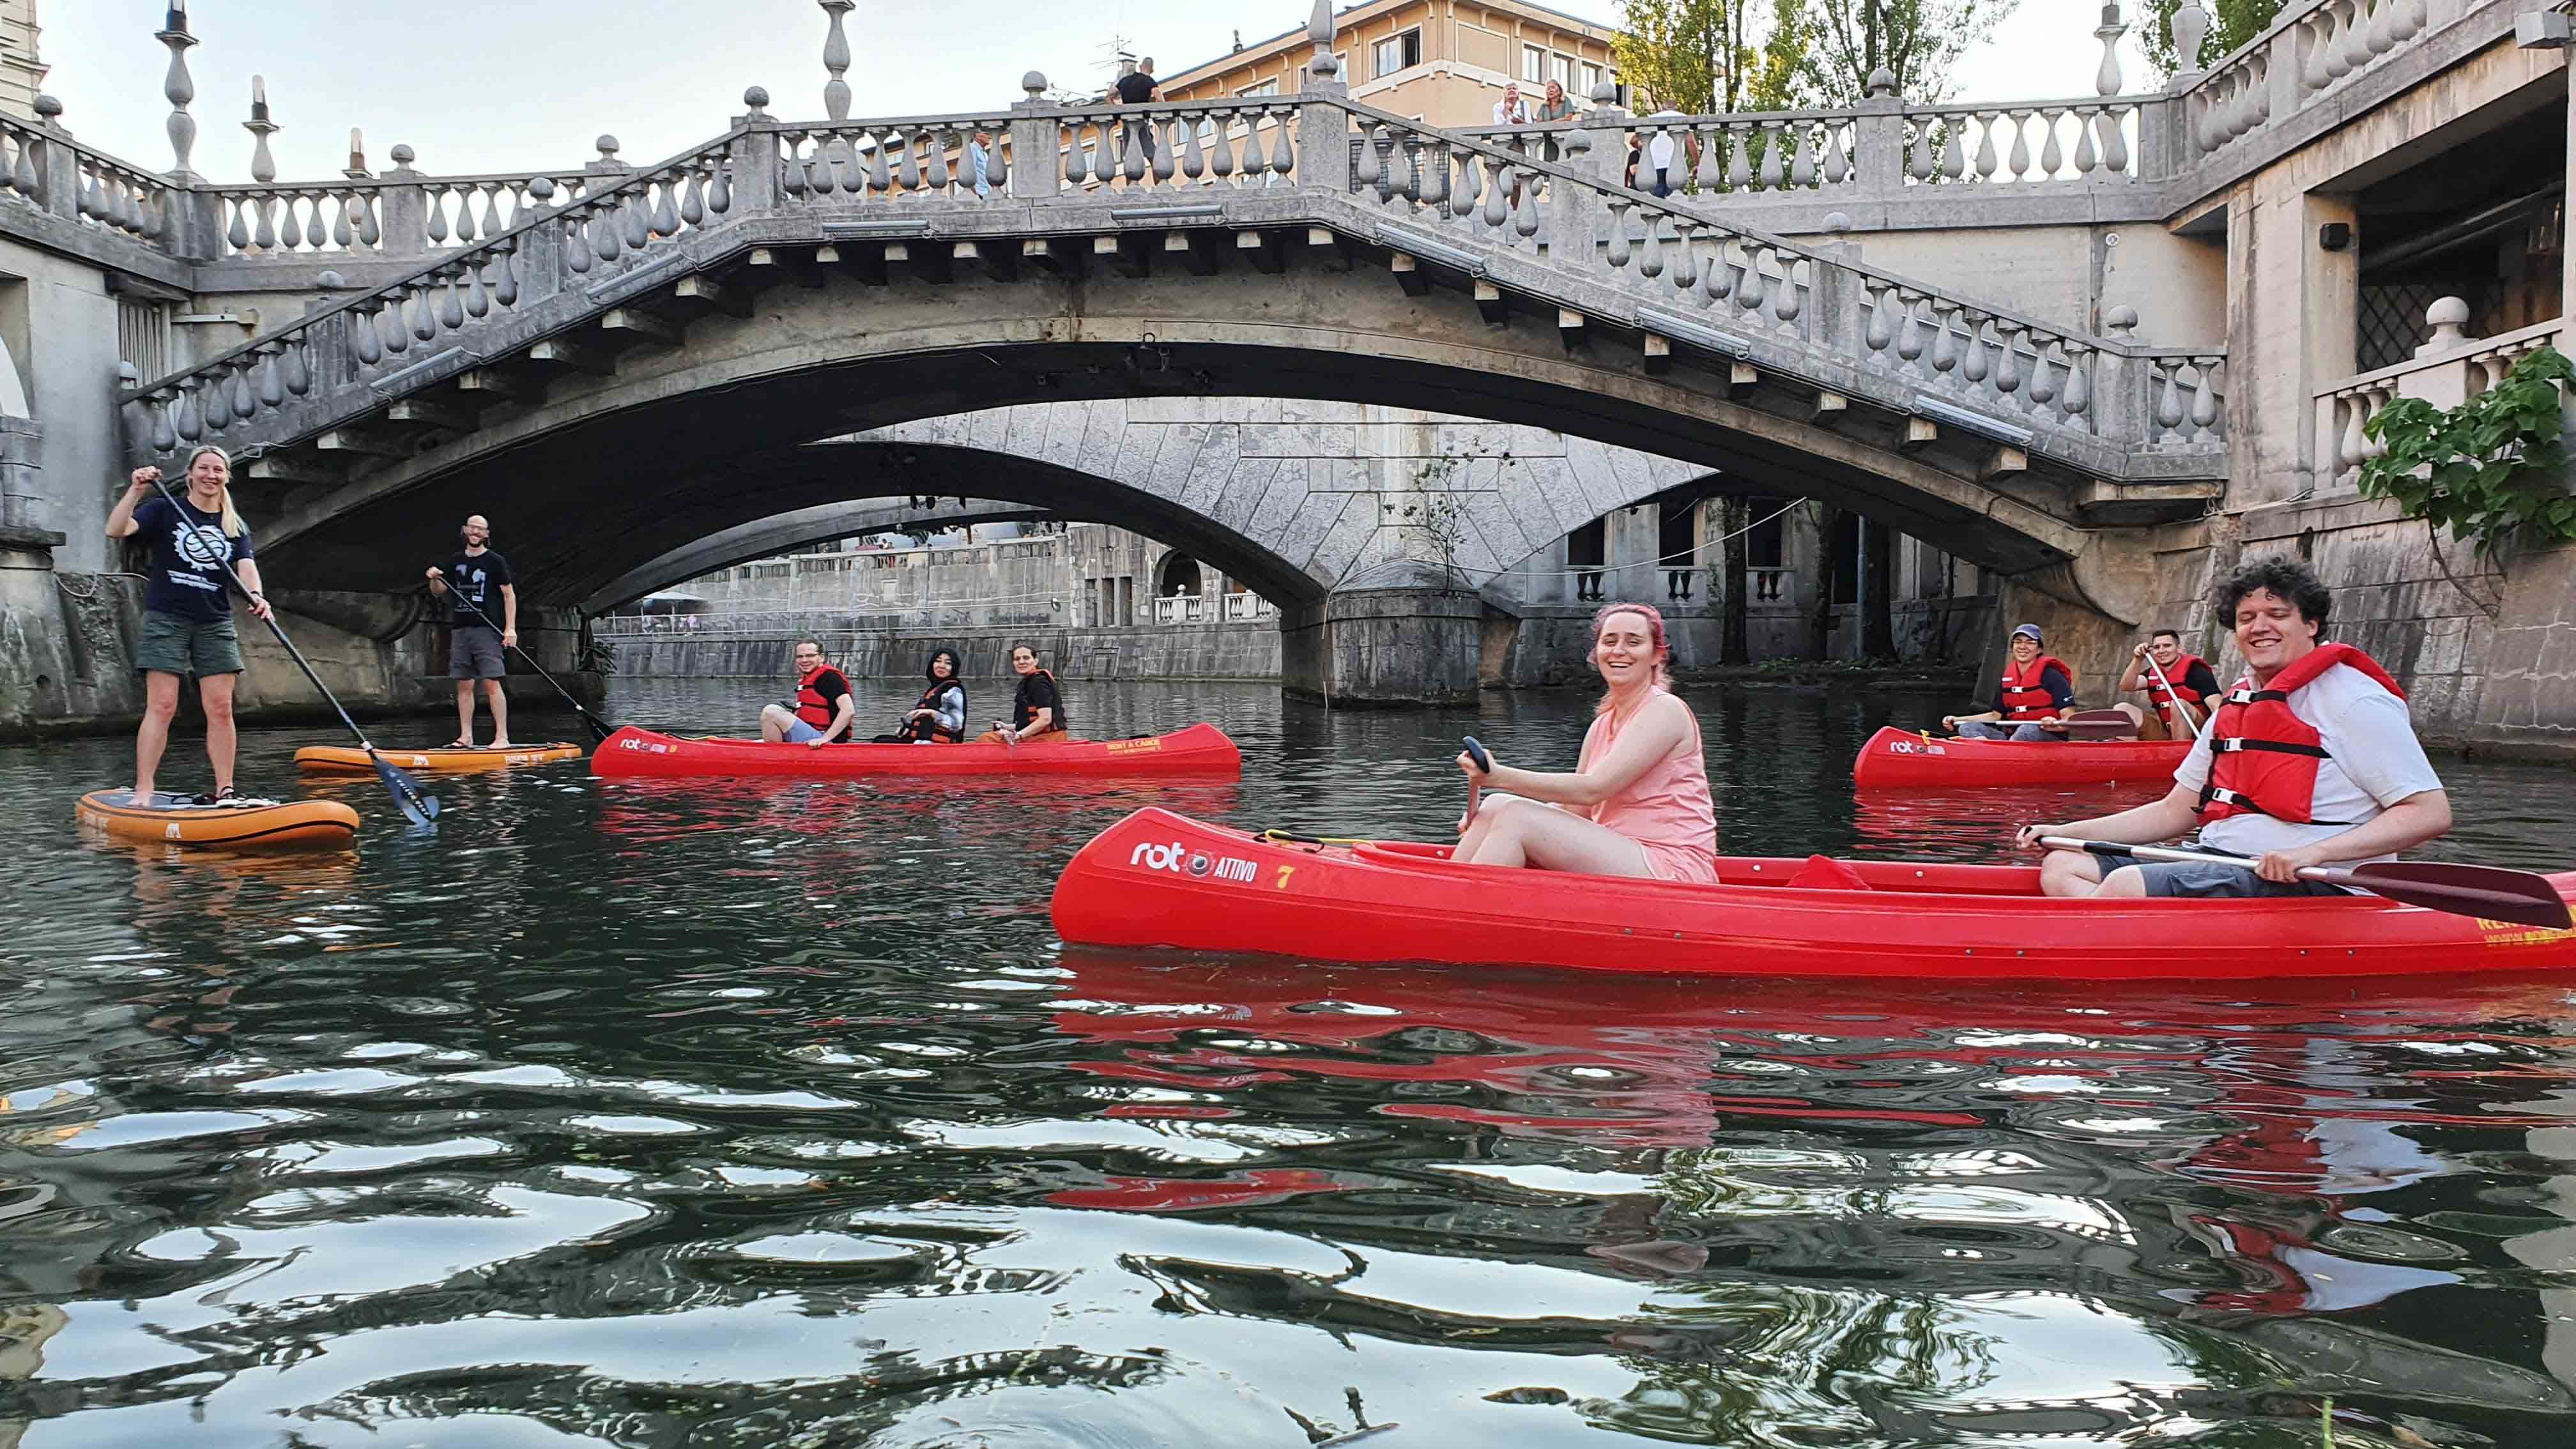
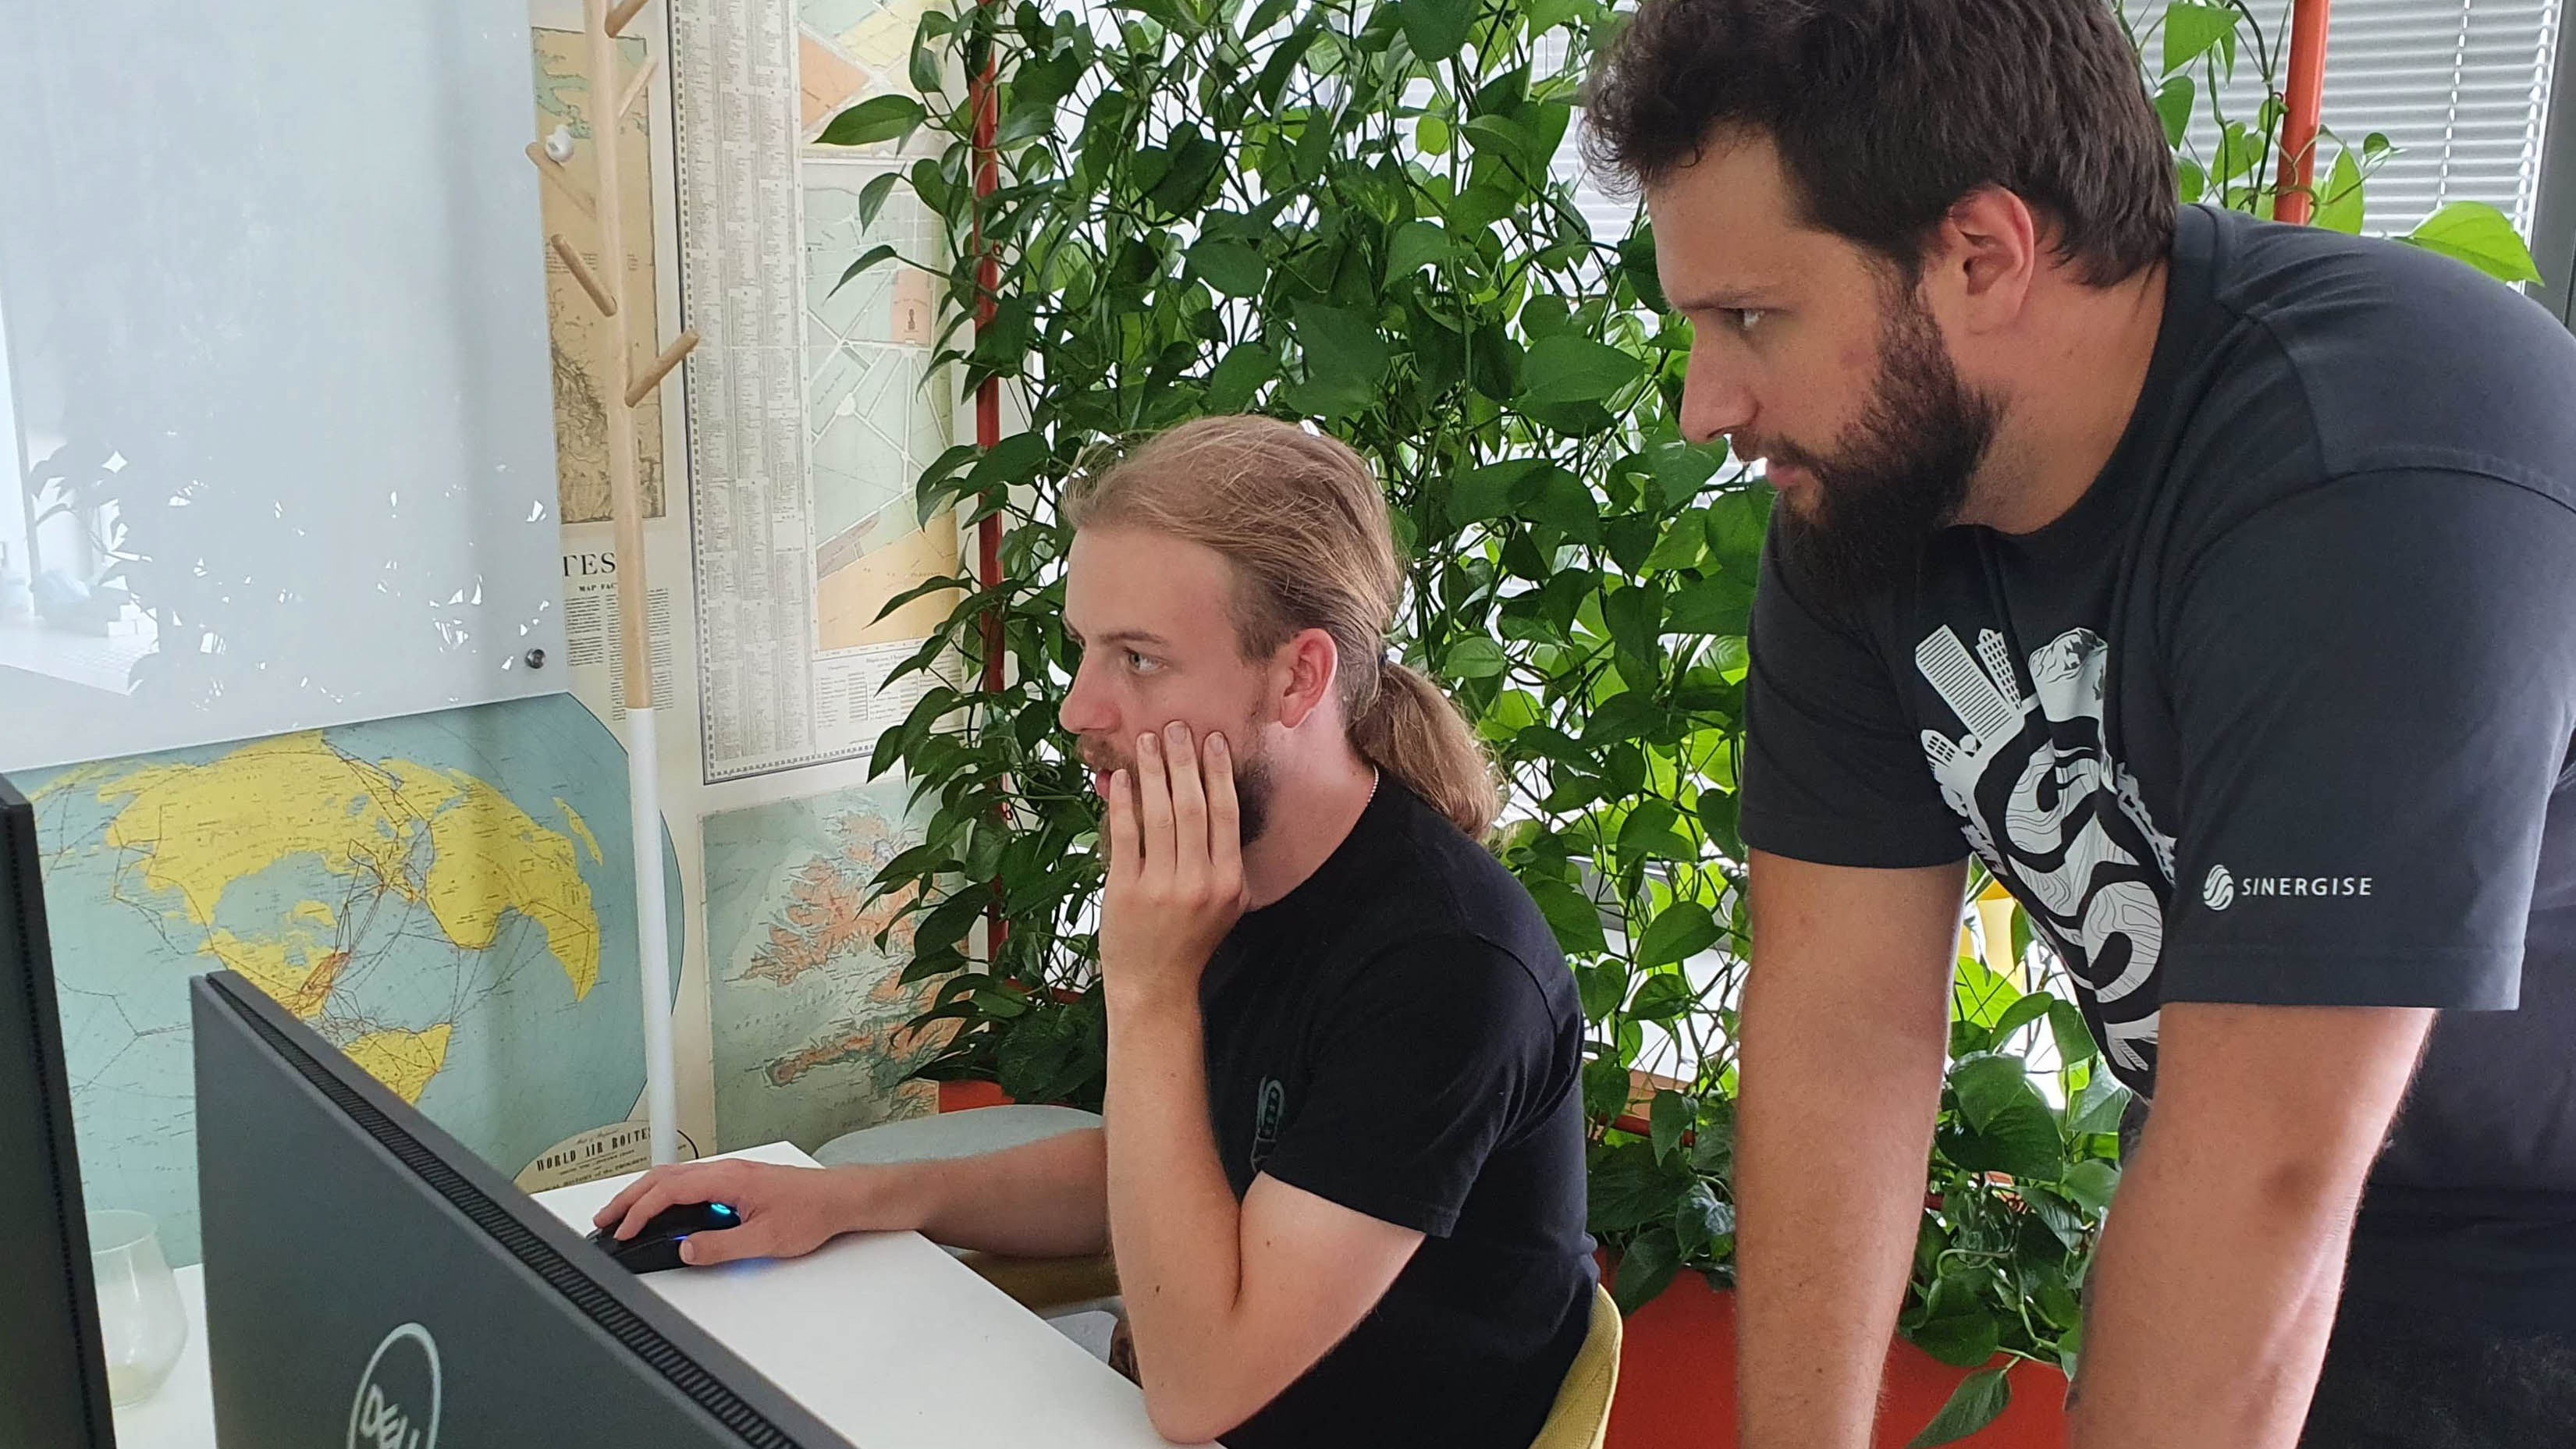
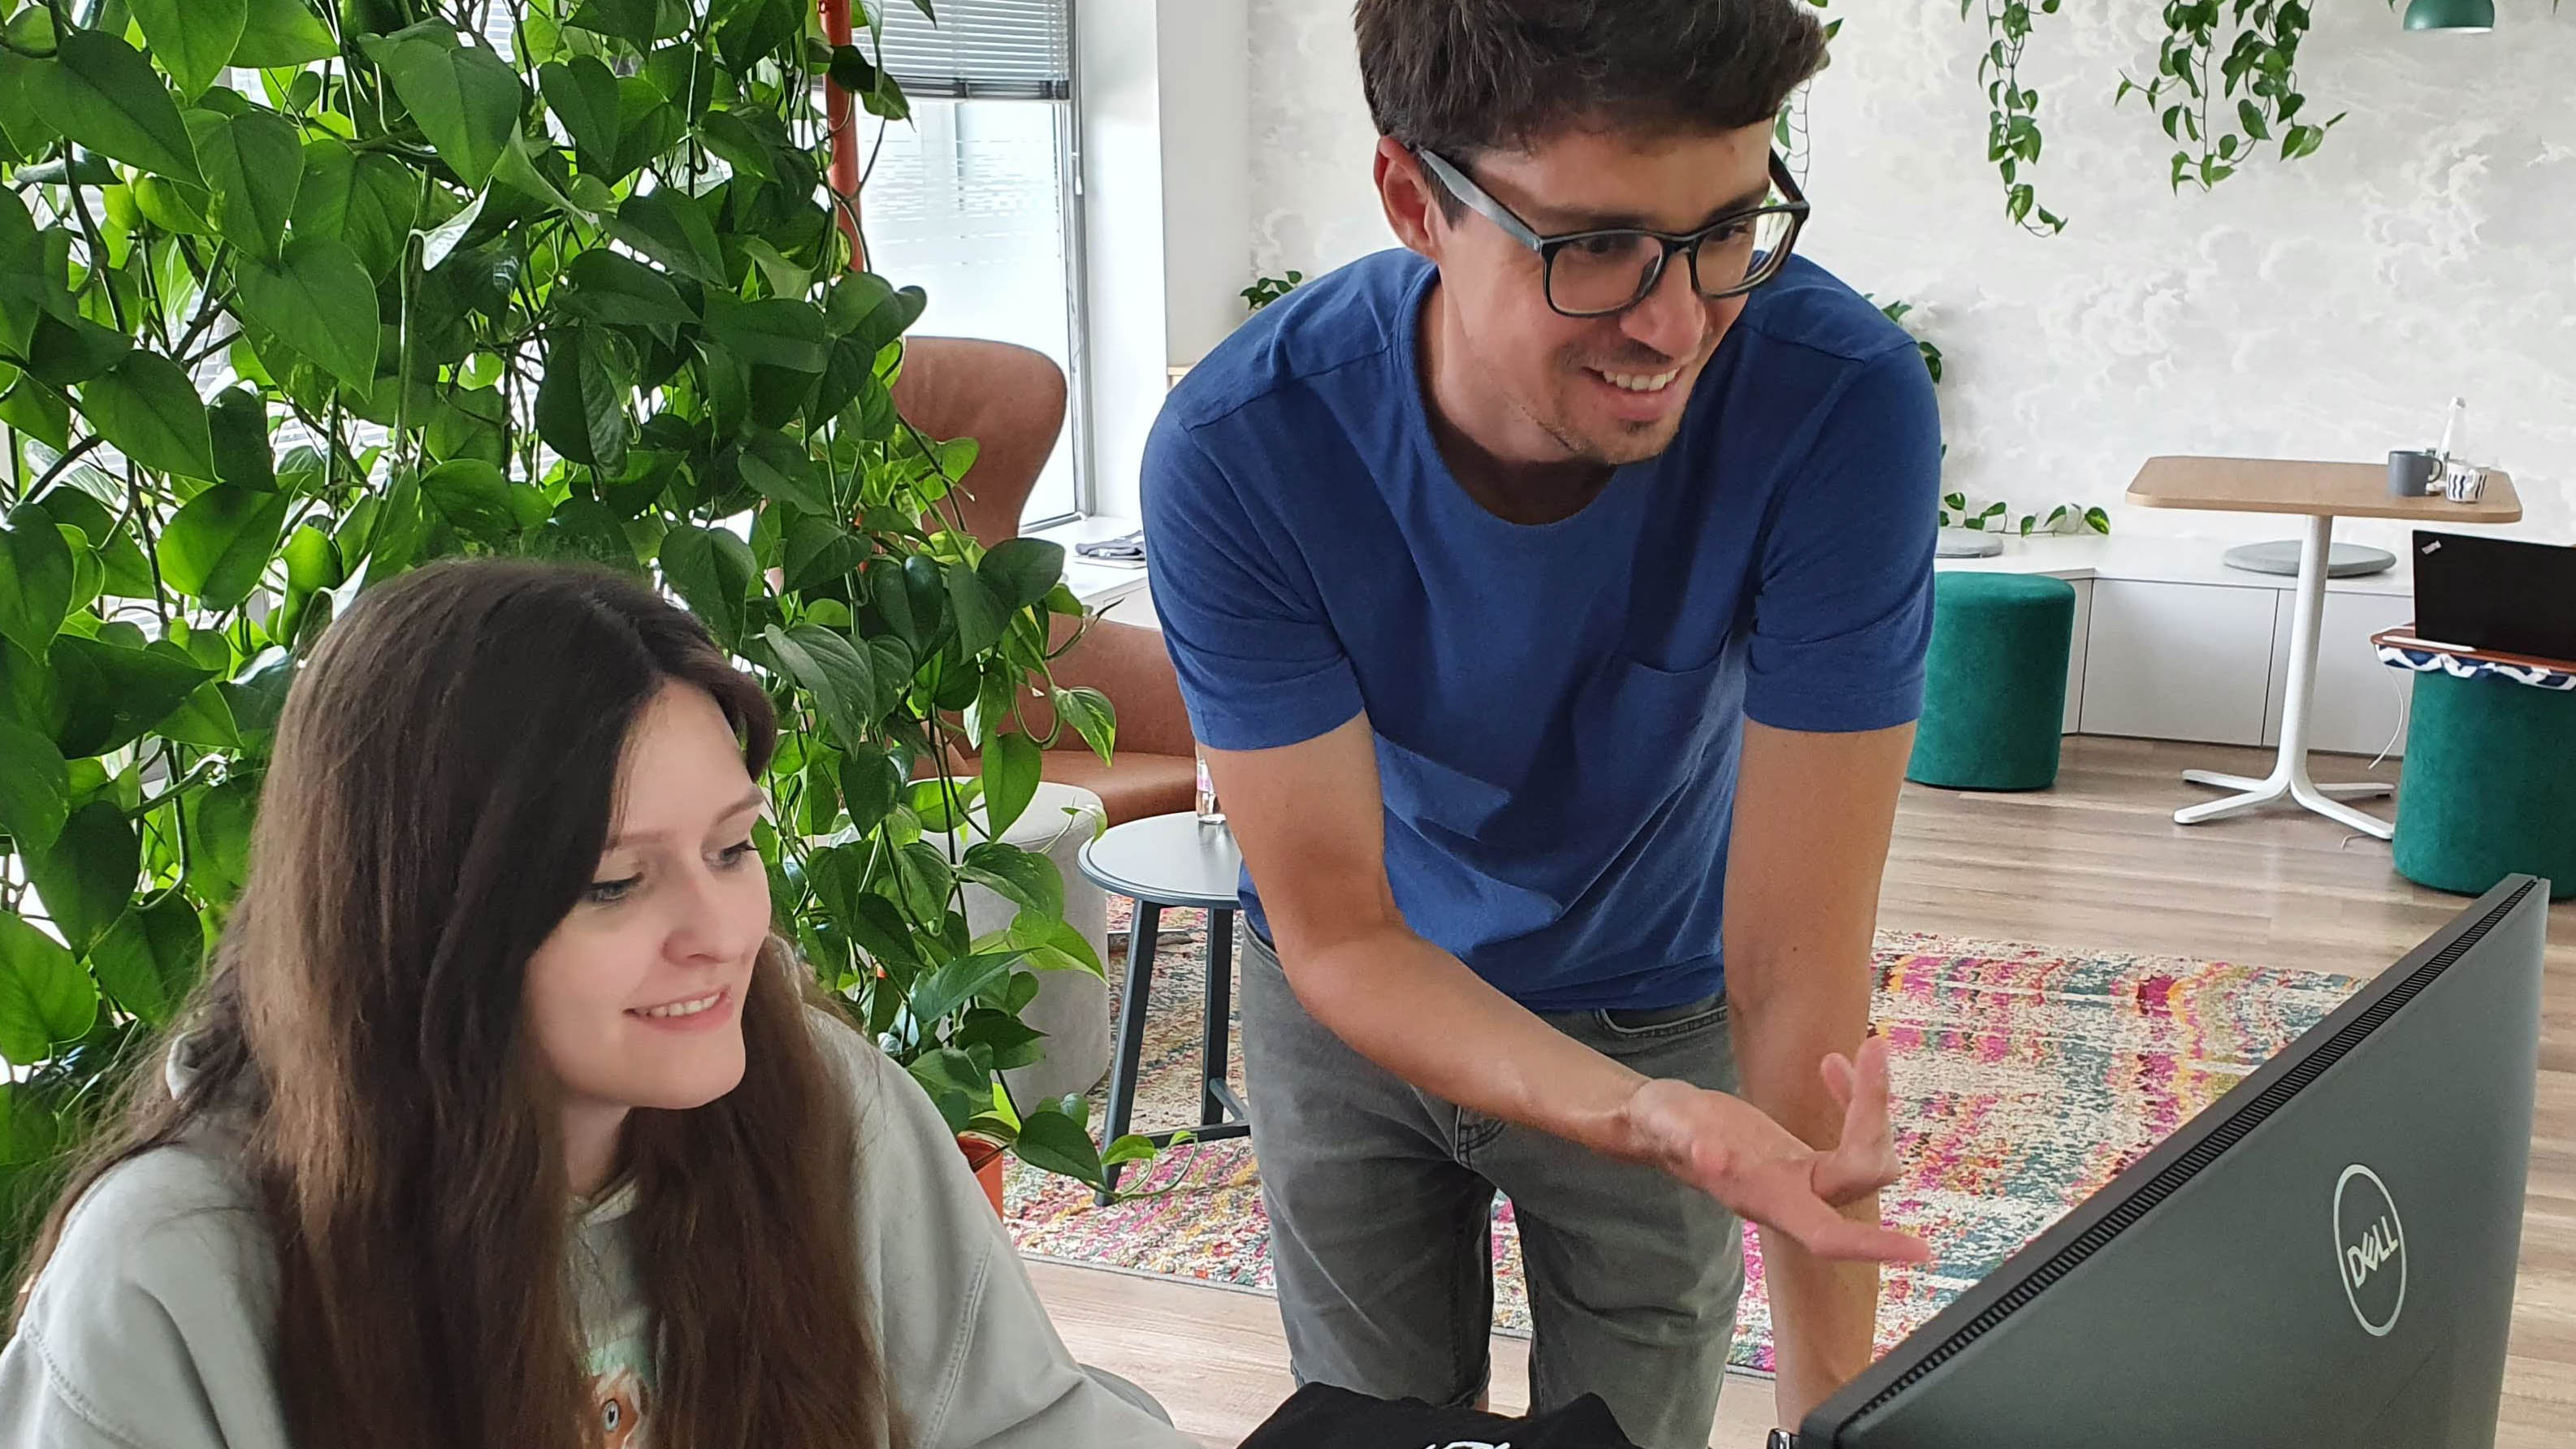
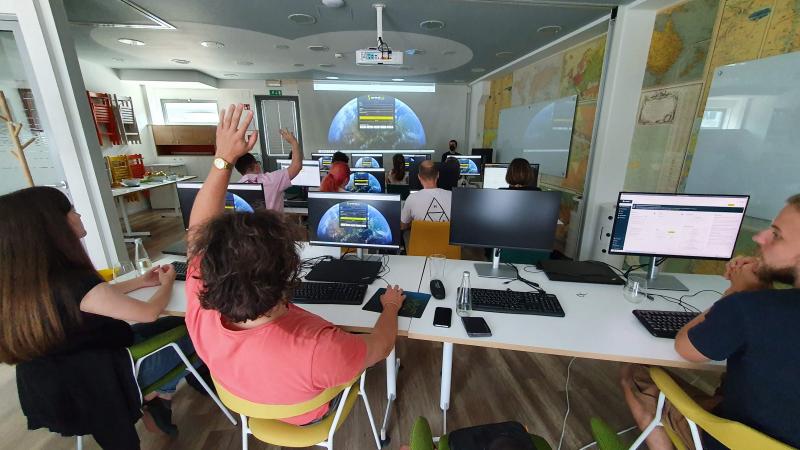
See also our gallery below!